PDF 原檔:報告_Citi_順達3211_20260729_original.pdf
圖片清單(已驗證 2026-07-31)
| 檔名 | size | 分類 | 親眼所見內容 |
|---|---|---|---|
260729_citi_dynapack_001.png |
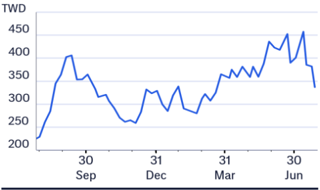
18KB | 裝飾·logo | 順達股價折線縮圖(<40KB,僅為頁首裝飾用縮圖,無座標軸標示) |
260729_citi_dynapack_002.png |
100KB | 真資料圖 | Bull/Bear 目標價情境圖:現價 NT$308.00(29 Jul 26),牛市 NT$1,000(+225% Upside)、基準 NT$800(+160% Upside)、熊市 NT$300(-2.6% Downside),三條虛線分別連向 Jul 27 三個目標價 |
260729_citi_dynapack_003.png |
64KB | 真資料圖 | 順達(3211.TWO)評等與目標價沿革圖(2024-2026),標示最新一次變動:07-Jul-26,評等 1(Buy)、目標價 TWD800、當時收盤價 TWD389 |
原始內容
(RIC: 3211.1 WO, BB: 3211 11)
TWD
450
400
350
300
250
200
Prepared for Kevin Lu
29 Jul 2026 09:52:50 ET │ 13 pages
Sep
Dec
Mar
Jun
Dynapack International (3211.TWO)
2Q26 Call Takeaways: BBU Ramp Back on Track; Stronger 2H26 Ahead
CITI'S TAKE
We came away from Dynapack's 2Q26 call with a more constructive view. Mgmt attributed weak 2Q margin mainly to an unfavorable mix as softer pull-ins for BBU models reduced the non-IT sales, while lower-margin IT mix increased. Importantly, BBU pull-ins have returned to normal from midJuly and 2H26 outlook remains solid, supported by sequential sales growth in 3Q/4Q, the launch of 8kW/12kW BBU and shipments to one new CSP customer from 4Q26E. We believe a 21% share price pullback vs. TAIEX's 10% over past 5 trading days is unwarranted in view of the solid 2H fundamentals. Reiterate our positive view with the 2H BBU ramp, customer expansion, and next gen product launches serving as key catalysts.
2Q margin pressure should prove temporary -The weaker 2Q GPM was primarily a product mix issue rather than an indication of weaker BBU demand. Customer pull-ins for certain BBU models were below expectations, reducing the non-IT sales mix to 25-30% of group sales vs. 40-50% in 1Q26. BBU pull-ins have resumed from mid-July and the mgmt. expects a higher non-IT mix to bring 2H26E GPM back to 1Q26 level. We therefore view 2Q as a temporary earnings trough.
Solid 2H26 outlook with a new CSP customer in 4Q -Mgmt expects sales to increase sequentially in both 3Q and 4Q, driven by strong datacenter BBU demand. Non-IT sales are expected to grow by double digits y/y and account for more than 50% of FY26 group sales. While IT sales are likely to decrease h/h due to higher notebook prices and tight memory supply, the improving BBU mix should support both top-line and margin recovery. One new CSP customer is scheduled to begin shipments in 4Q26, further broadening Dynapack's customer base.
Higher capex reflects confidence in the demand -Mgmt raised its 2026E capex plan to NT$1bn vs. NT$600-800mn prior and will continue expanding capacity in both Taiwan and Thailand. FY26 capacity is expected to be twice the FY25 level with further expansion planned for 2027-2028E. Current BBU UT is 60-70% and the mgmt expects it to reach 80% in 2027 despite the additional capacity. We believe the combination of accelerating investment and rising forward UT provides a strong indication of customer visibility and confidence in sustained BBU demand. (continued next page)
Earnings Summary
| Year to 31Dec | Net Profit (NT$M) | DilutedEPS (NT$) | EPSgrowth (%) | P/E (x) | P/B (x) | ROE (%) | Yield (%) |
|---|---|---|---|---|---|---|---|
| 2024A | 2,673 | 17.59 | 236.1 | 17.5 | 4.4 | 28 | 4.1 |
| 2025A | 1,382 | 9.05 | -48.5 | 34 | 4.7 | 13.4 | 3.7 |
| 2026E | 2,178 | 14.25 | 57.4 | 21.6 | 5.3 | 23.2 | 3.7 |
| 2027E | 3,821 | 25 | 75.5 | 12.3 | 4.9 | 41.5 | 6.5 |
| 2028E | 5,709 | 37.35 | 49.4 | 8.2 | 4.4 | 56.2 | 9.7 |
Source: Powered by dataCentral
See Appendix A-1 for Analyst Certification, Important Disclosures and Research Analyst Affiliations.
n Buy
Price (29 Jul 26 15:00)
NT$308.00
Target price
NT$800.00
Expected share price return
159.7%
Expected dividend yield
3.9%
Expected total return
163.6%
Market Cap
NT$47,526M
US$1,468M
Price Performance (RIC: 3211.TWO, BB: 3211 TT)
Angela Hsu AC
+886-2-8726-9083 angela.hc.hsu@citi.com
Prepared for Kevin Lu
| 3211.TWO: Fiscalyearend31-Dec | Price:NT$308.00; TP:NT$800.00; MarketCap:NT$47,526m; Recomm:Buy | Price:NT$308.00; TP:NT$800.00; MarketCap:NT$47,526m; Recomm:Buy | Price:NT$308.00; TP:NT$800.00; MarketCap:NT$47,526m; Recomm:Buy | Price:NT$308.00; TP:NT$800.00; MarketCap:NT$47,526m; Recomm:Buy | Price:NT$308.00; TP:NT$800.00; MarketCap:NT$47,526m; Recomm:Buy | ||||||
|---|---|---|---|---|---|---|---|---|---|---|---|
| Profit&Loss(NT$m) | 2024 | 2025 | 2026E | 2027E | 2028E | Valuation ratios | 2024 | 2025 | 2026E | 2027E | 2028E |
| Sales revenue | 13,912 | 13,218 | 17,783 | 24,096 | 31,778 | PE(x) | 17.5 | 34.0 | 21.6 | 12.3 | 8.2 |
| Cost of sales | -12,327 | -11,025 | -13,936 | -17,830 | -22,710 | PB(x) | 4.4 | 4.7 | 5.3 | 4.9 | 4.4 |
| Gross profit | 1,584 | 2,193 | 3,847 | 6,266 | 9,068 | EV/EBITDA(x) | 14.4 | 21.6 | 14.5 | 8.6 | 5.9 |
| Gross Margin (%) | 11.4 | 16.6 | 21.6 | 26.0 | 28.5 | FCFyield (%) | 2.3 | 3.2 | 3.3 | 7.4 | 5.8 |
| EBITDA(Adj) | 2,997 | 1,981 | 2,989 | 5,014 | 7,350 | Dividend yield (%) | 4.1 | 3.7 | 3.7 | 6.5 | 9.7 |
| EBITDAMargin(Adj) (%) | 21.5 | 15.0 | 16.8 | 20.8 | 23.1 | Payout ratio (%) | 71 | 127 | 80 | 80 | 80 |
| Depreciation | -294 | -290 | -383 | -403 | -406 | ROE(%) | 28.0 | 13.4 | 23.2 | 41.5 | 56.2 |
| Amortisation | 0 | 0 | 0 | 0 | 0 | Cashflow(NT$m) | 2024 | 2025 | 2026E | 2027E | 2028E |
| EBIT (Adj) | 743 | 1,247 | 2,659 | 4,690 | 7,013 | EBITDA | 1,038 | 1,537 | 3,043 | 5,092 | 7,419 |
| EBIT Margin (Adj) (%) | 5.3 | 9.4 | 15.0 | 19.5 | 22.1 | Working capital | 525 | -500 | -317 | -338 | -2,980 |
| Net interest | 0 | 0 | 0 | 0 | 0 | Other | -356 | 618 | -461 | -869 | -1,304 |
| Associates | 0 | 0 | 0 | 0 | 0 | Operating cashflow | 1,206 | 1,655 | 2,265 | 3,886 | 3,135 |
| Non-Op/Except/Other Adj | 2,180 | 553 | 30 | 5 | 15 | Capex | -146 | -167 | -708 | -400 | -400 |
| Pre-tax profit | 2,924 | 1,800 | 2,689 | 4,695 | 7,028 | Net acq/disposals | -784 | 2,992 | -2,325 | 0 | 0 |
| Tax | -251 | -418 | -512 | -874 | -1,319 | Other | 2,144 | -385 | -32 | 0 | 976 |
| Extraord./Min.Int./Pref.div. | 0 | 0 | 0 | 0 | 0 | Investing cashflow | 1,214 | 2,439 | -3,066 | -400 | 576 |
| Reported net profit | 2,673 | 1,382 | 2,178 | 3,821 | 5,709 | Dividends paid | -840 | -1,907 | -1,742 | -3,057 | -4,567 |
| Net Margin (%) | 19.2 | 10.5 | 12.2 | 15.9 | 18.0 | Financing cashflow | -2,103 | -2,885 | -176 | -4,057 | -4,567 |
| CoreNPAT | 2,673 | 1,382 | 2,178 | 3,821 | 5,709 | Net change in cash | 549 | 899 | -852 | -571 | -856 |
| Per share data | 2024 | 2025 | 2026E | 2027E | 2028E | Free cashflow to s/holders | 1,060 | 1,488 | 1,557 | 3,486 | 2,735 |
| Reported EPS($) | 17.59 | 9.05 | 14.25 | 25.00 | 37.35 | ||||||
| Core EPS($) | 17.59 | 9.05 | 14.25 | 25.00 | 37.35 | ||||||
| DPS($) | 12.50 | 11.47 | 11.40 | 20.00 | 29.88 | ||||||
| CFPS($) | 7.94 | 10.84 | 14.82 | 25.42 | 20.51 | ||||||
| 6.98 | 9.75 | 10.18 | 22.80 | ||||||||
| FCFPS($) | 17.89 | ||||||||||
| Wtdavgordshares(m) | 152 | 153 | 153 | 153 | 153 | ||||||
| Wtdavgdiluted shares (m) | 152 | 153 | 153 | 153 | 153 | ||||||
| Growthrates | 2024 | 2025 | 2026E | 2027E | 2028E | ||||||
| Sales revenue (%) | -19.3 | -5.0 | 34.5 | 35.5 | 31.9 | ||||||
| EBIT (Adj) (%) | 6.3 | 67.8 | 113.3 | 76.3 | 49.5 | ||||||
| CoreNPAT(%) | 239.2 | -48.3 | 57.6 | 75.5 | 49.4 | ||||||
| CoreEPS(%) | 236.1 | -48.5 | 57.4 | 75.5 | 49.4 | ||||||
| BalanceSheet(NT$m) | 2024 | 2025 | 2026E | 2027E | 2028E | ||||||
| Cash&cashequiv. | 6,330 | 4,185 | 5,678 | 5,107 | 4,251 | ||||||
| Accounts receivables | 3,100 | 3,545 | 3,802 | 5,085 | 8,299 | ||||||
| Inventory | 1,046 | 1,842 | 2,540 | 2,615 | 3,073 | ||||||
| Net fixed | 4,786 | 5,361 | 5,748 | 5,745 | 4,763 | ||||||
| &other tangibles Goodwill &intangibles | 306 | 260 | 353 | 353 | 353 | ||||||
| Financial &other assets | 811 | 396 | 427 | 427 | 427 | ||||||
| Total assets | 16,378 | 15,589 | 18,547 | 19,331 | 21,165 | ||||||
| Accounts payable | 2,172 | 2,910 | 3,556 | 4,576 | 5,267 | ||||||
| Short-term debt | 984 | 0 | 1,581 | 581 | 581 | ||||||
| Long-term debt | 0 | 0 | 0 | 0 | 0 | ||||||
| Provisions &other liab | 2,499 | 2,706 | 4,590 | 4,590 | 4,590 | ||||||
| Total liabilities | 5,655 | 5,616 | 9,727 | 9,747 | 10,438 | ||||||
| Shareholders' equity | 10,723 0 | 0 | 0 | 10,726 | |||||||
| Minority interests | 9,972 0 | 8,820 | 9,585 | 0 | |||||||
| Total equity | 10,723 | 9,972 | 8,820 | 9,585 | 10,726 | ||||||
| Net debt (Adj) | -5,346 | -4,185 | -4,097 | -4,526 | -3,670 | ||||||
| Net debt to equity (Adj) (%) | -49.9 | -42.0 | |||||||||
| For definitions of the items in this table, | please click here. | -46.4 | -47.2 | -34.2 |
Prepared for Kevin Lu
Product roadmap moving toward higher power rating products -The 3.3kW and 5.5kW products remain Dynapack's mainstream BBU offerings in 2026E. However, shipment of higher-value 8kW and 12kW products remain on track to begin in 4Q26E with ASPs above those of existing models. 25kW BBU is currently under development and customer validation, with mass production targeted for 2027E. We believe the migration toward higher-power products should expand Dynapack's addressable content per system and provide a favorable long-term product mix tailwind.
HVDC development remains on track -Dynapack is working closely with PSU partners on next generation HVDC BBU products with customer validation underway and mass production expected in 2027E. Mgmt believes BBU will likely become a necessary component under HVDC architecture. Potential changes to the timing of HVDC adoption should have limited structural impact, as they would mainly shift the shipment schedule.
Lower our 2026E earnings by 5% and keep 2027/2028 earnings largely unchanged -We lower our earnings estimate 5% for 2026E mainly to factor in 2Q26 results miss owing to the delayed shipment of certain BBU models, leading to a significant margin contraction due to an unfavorable product mix. We keep our earnings estimates largely unchanged for 2027E and 2028E. We thus retain our TP of NT$800 based on 32x on 2027E P/E.
Figure 1. Dynapack: Our Earnings Estimate Revisions
| 2026E | 2026E | 2026E | 2027E | 2027E | 2027E | 2028E | 2028E | 2028E | |
|---|---|---|---|---|---|---|---|---|---|
| NT$ mn | New | Old | Chg | New | Old | Chg | New | Old | Chg |
| Revenue | 17,783 | 17,803 | 0% | 24,096 | 24,072 | 0% | 31,778 | 31,902 | 0% |
| Gross profit | 3,847 | 3,956 | -3% | 6,266 | 6,250 | 0% | 9,068 | 9,061 | 0% |
| Operatingprofit | 2,659 | 2,759 | -4% | 4,690 | 4,685 | 0% | 7,013 | 7,056 | -1% |
| Pre-tax profit | 2,689 | 2,824 | -5% | 4,695 | 4,720 | -1% | 7,028 | 7,071 | -1% |
| Net profit | 2,178 | 2,293 | -5% | 3,821 | 3,822 | 0% | 5,709 | 5,710 | 0% |
| Basic EPS(NT$) | 14.25 | 15.00 | -5% | 25.00 | 25.00 | 0% | 37.35 | 37.35 | 0% |
| Ratio | |||||||||
| Gross margin (%) | 21.6 | 22.2 | -0.6 | 26.0 | 26.0 | 0.0 | 28.5 | 28.4 | 0.1 |
| OPEXto Sales ratio (%) | (6.7) | (6.7) | 0.1 | (6.5) | (6.5) | 0.0 | (6.5) | (6.3) | -0.2 |
| Operatingmargin (%) | 15.0 | 15.5 | -0.5 | 19.5 | 19.5 | 0.0 | 22.1 | 22.1 | 0.0 |
| Net margin (%) | 12.2 | 12.9 | -0.6 | 15.9 | 15.9 | 0.0 | 18.0 | 17.9 | 0.1 |
© 2026 Citigroup Inc. No redistribution without Citigroup's written permission.
Source: Citi Research, Citi Research Estimates
NT$
1,002
835
668
501
334
167
Jul 25
yo Sales CAGR of 40% in 2025-2027E
• 2027E target P/E of 35x
A 225% Upside
NT$ 800.00
A 160% Upside
NT$ 300.00
· 2.6% Downside
Bull/Bear: Dynapack International (3211.TWO)
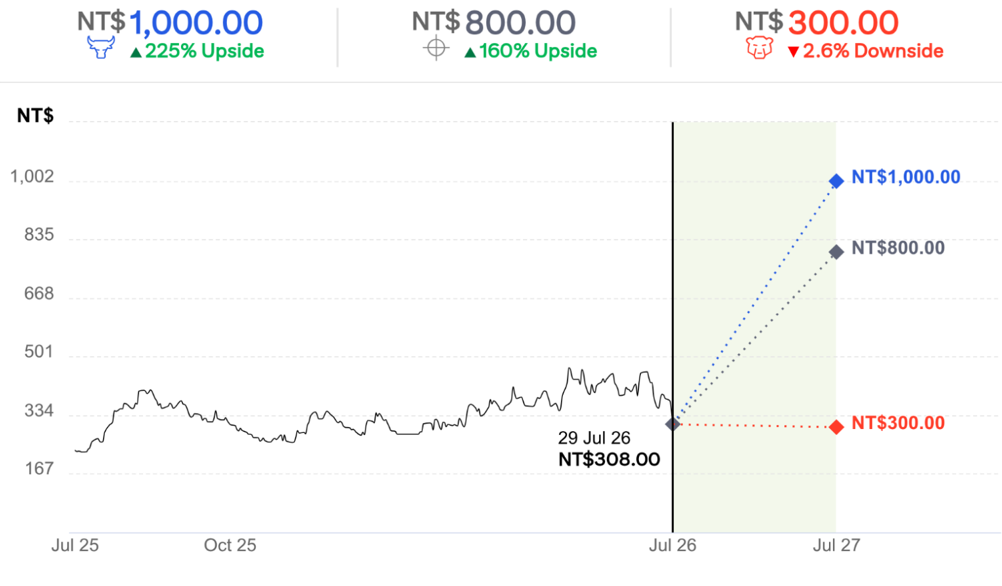
BASE Assumptions
Sales CAGR of 35% in 2025-2027E
- Earnings CAGR of 66% in 2025-2027E
• 2027E target P/E of 32x
BEAR Assumptions
- {• Sales CAGR of 20-25% in 2025-2027E
• Earnings CAGR of 30-40% in 2025-2027E
• 2027E target P/E of 18x
Prepared for Kevin Lu
Prepared for Kevin Lu
Dynapack International
Company description
Established in 1998 and listed on the Taipei Exchange in 2004, Dynapack is a Taiwan-based lithium-ion battery pack manufacturer, focusing on customized battery pack design, engineering, manufacturing and system integration. Dynapack built its foundation in notebook and mobile-device battery packs with certifications from major international brands. In recent years, it has expanded beyond traditional IT applications into higher-growth non-IT segments. In 2025, non-IT sales made up 35% of group sales, up from 5-10% in 2020. We estimate BBU to make up the majority of non-IT sales.
Investment strategy
We have a Buy rating on Dynapack shares. Our positive view is driven by Dynapack's transition from a mature IT battery pack supplier to a key beneficiary of AIDC BBU demand. As AI rack power density rises, we expect BBU adoption and content value per rack to increase, supporting robust revenue growth. We also expect meaningful margin expansion as product mix shifts toward higher-margin BBU products. In addition, Dynapack's partnership with multiple PSU operators should broaden its access to CSP and AIDC customers. We forecast earnings CAGR of 60% in 2025-2028E.
Valuation
We assign a 32x target P/E to our 2027E EPS of NT$25 to derive a target price of NT$800. We value Dynapack based on 2027E target P/E as we believe 2027E better reflects its earnings power after BBU capacity expansion. Our target P/E of 32x is based on our forecast EPS CAGR of 66% in 2025-2027E and a PEG of 0.5x, which we benchmark against its major PSU partner, as we expect Dynapack to grow alongside its partner.
Risks
Our quantitative model assigns a High Risk rating to Dynapack. However, we believe such a rating is not warranted for Dynapack due to: 1) the company is generating solid revenue and earnings growth over next 3 years; the underlying industry, BBU for AIDC, also enjoys secular growth; 2) the business model that involves with product customization and strict safety/reliability requirements would imply relatively benign competition and therefore stable pricing and margins; and 3) the company has a strong balance sheet and has been in net cash position since 2019.
Key downside risks to our price target/rating are: 1) Slower-than-expected BBU adoption in AIDC, 2) Delay in PSU customer qualifications, 3) Competition from larger battery or power solution vendors, 4) Safety, certification and reliability issues.
Analyst: Angela Hsu
Prepared for Kevin Lu
Date
TWD
400
200
If you are visually impaired and would like to speak to a Citi representative regarding the details of the graphics in this document, please call USA 1-888-500-5008 (TTY: 711), from outside the US +1-210-677-3788 DJ FM ¡EMAMIJASO DJFM A MI