PDF 原檔:報告_Citi_美利達9914_20260814_original.pdf
OCR 缺字警告
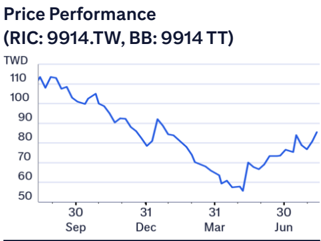
開頭股價走勢圖座標數字(110/100/90…)與 (RIC: 9914.1W, BB: 9914 11) 為 OCR 錯亂,實際應為 9914.TW / 9914 TT;正文其餘 9914.TW 標示正確。金額數字已與內文交叉比對,模糊處標「待核對」。
圖片清單(已驗證 2026-08-17)
| 檔名 | size | 分類 | 親眼所見內容 |
|---|---|---|---|
260814_citi_merida_001.png |
25KB | 未驗證(<40KB,預設 logo) | — |
260814_citi_merida_002.png |
90KB | 真資料圖 | Bull/Base/Bear 目標價情境圖:藍色 Bull NT$118(+42%)、灰色 Base NT$93(+12%)、紅色 Bear NT$70(-16%);左側股價走勢線圖至 2026-08-14 收盤 NT$83.30,右側三色虛線扇形延伸至 2026-08-27 |
260814_citi_merida_003.png |
198KB | 真資料圖 | 上半「Ratings and Target Price History」股價走勢圖(2023/09–2026/08)疊加 12 個評等/目標價調整節點編號與對照表(日期、Rating、Target Price、Closing Price),目標價由 NT$215 一路下修至 NT$72、最新 NT$93;下半「Short-Term View/Catalyst Watch」同期股價圖疊加 4 個 CW/STV 添加移除節點 |
原始內容
(RIC: 9914.1W, BB: 9914 11)
TWD
110
100
90
80
70
60
50
Prepared for Kevin Lu
14 Aug 2026 11:29:00 ET │ 13 pages
Sep
Dec
Mar
Jun
Merida (9914.TW)
China and EU Improve; SBC Visibility Remains Low
CITI'S TAKE
We maintain our Neutral rating as we believe Merida's better core biz recovery helped by strong China and EU subsidiaries is balanced by low visibility of SBC and limited near-term catalysts. Resilient China demand, EU inventory normalization and a better mix should support margins, but soft OEM and e-bike shipments and strategic reductions in outgoing model supply will likely constrain near-term sales growth. We raise our 20262028E earnings forecasts by 3-5% and lift our TP to NT$93, based on 15.5x NTM P/E. A more constructive view would require clearer evidence of sustainable SBC profitability, stronger OEM orders or better sell-through from upcoming product launches.
Outlook: TW plant shipment down single digit y/y while China turns positive y/y for FY26 -China shipments are guided to increase to 700K units from 630K in 2025, while TW pedal bike shipments should increase to 160K units from 140K. By contrast, TW e-bikes shipments are expected to drop to 120K in 2026 from 170K in 2025, reflecting a higher base and continued adjustment in e-bike biz. All in, Merida expects FY26 group sales to decrease by low teens y/y.
SBC: underlying profitability improved, yet tax a major drag -SBC 1H26 sales decreased by a single digit y/y, partly because it strategically reduced supply of outgoing models ahead of product launches. Nevertheless, pre-tax profit rose 41% y/y and pre-tax margin expanded to 6% from 3%, suggesting meaningful improvement in underlying operations. All regions except US were profitable; however, US losses combined with a larger accrual tax resulted in a higher effective tax rate, leading to a net loss. Mgmt. expects SBC's bottom-line to generate a profit comparable with 2025.
China: better than expected growth led by affordable products -China delivered 1H26 unit growth of 13% y/y and sales growth of 6% y/y, driven by resilient demand for entry level bikes. The lower sales growth relative to unit growth reflects a shift toward more affordable models, with 2Q26 ASP at RMB 1,550. Mgmt. notes the underlying demand is returning to a healthier and more rational pattern. China 1H26 GPM reached c.15% vs. 11% for TW plant. (continued)
Earnings Summary
| Year to 31Dec | Net Profit (NT$M) | DilutedEPS (NT$) | EPSgrowth (%) | P/E (x) | P/B (x) | ROE (%) | Yield (%) |
|---|---|---|---|---|---|---|---|
| 2024A | -699 | -2.34 | -141.3 | na | 1.3 | -3.5 | 4.8 |
| 2025A | 1,200 | 4.01 | 271.7 | 20.8 | 1.3 | 6.2 | 3 |
| 2026E | 1,590 | 5.32 | 32.4 | 15.7 | 1.2 | 8 | 3.9 |
| 2027E | 2,024 | 6.77 | 27.3 | 12.3 | 1.2 | 9.8 | 5 |
| 2028E | 2,325 | 7.78 | 14.9 | 10.7 | 1.1 | 10.8 | 5.8 |
Source: Powered by dataCentral
See Appendix A-1 for Analyst Certification, Important Disclosures and Research Analyst Affiliations.
n Neutral
Price (14 Aug 26 13:30)
NT$83.30
Target price
NT$93.00↑
from NT$72.00
Expected share price return
11.6%
Expected dividend yield
2.6%
Expected total return
14.3%
Market Cap
NT$24,905M US$775M
Angela Hsu AC
+886-2-8726-9083 angela.hc.hsu@citi.com
Prepared for Kevin Lu
| 9914.TW: Fiscalyearend31-Dec | Price: NT$83.30; TP:NT$93.00; MarketCap:NT$24,905m; Recomm:Neutral | Price: NT$83.30; TP:NT$93.00; MarketCap:NT$24,905m; Recomm:Neutral | Price: NT$83.30; TP:NT$93.00; MarketCap:NT$24,905m; Recomm:Neutral | Price: NT$83.30; TP:NT$93.00; MarketCap:NT$24,905m; Recomm:Neutral | Price: NT$83.30; TP:NT$93.00; MarketCap:NT$24,905m; Recomm:Neutral | ||||||
|---|---|---|---|---|---|---|---|---|---|---|---|
| Profit&Loss(NT$m) | 2024 | 2025 | 2026E | 2027E | 2028E | Valuation ratios | 2024 | 2025 | 2026E | 2027E | 2028E |
| Sales revenue | 29,633 | 26,757 | 24,505 | 26,129 | 27,896 | PE(x) | -35.6 | 20.8 | 15.7 | 12.3 | 10.7 |
| Cost of sales | -24,253 | -22,985 | -20,256 | -21,815 | -23,225 | PB(x) | 1.3 | 1.3 | 1.2 | 1.2 | 1.1 |
| Gross profit | 5,380 | 3,773 | 4,249 | 4,315 | 4,671 | EV/EBITDA(x) | 3.8 | 7.0 | 5.3 | 4.9 | 4.1 |
| Gross Margin (%) | 18.2 | 14.1 | 17.3 | 16.5 | 16.7 | FCFyield (%) | 8.5 | 9.4 | 9.9 | 6.9 | 8.3 |
| EBITDA(Adj) | 3,349 | 1,947 | 2,280 | 2,276 | 2,560 | Dividend yield (%) | 4.8 | 3.0 | 3.9 | 5.0 | 5.8 |
| EBITDAMargin(Adj) (%) | 11.3 | 7.3 | 9.3 | 8.7 | 9.2 | Payout ratio (%) | -171 | 62 | 62 | 62 | 62 |
| Depreciation | -294 | -265 | -279 | -282 | -284 | ROE(%) | -3.5 | 6.2 | 8.0 | 9.8 | 10.8 |
| Amortisation | -21 | -18 | -13 | -13 | -13 | Cashflow(NT$m) | 2024 | 2025 | 2026E | 2027E | 2028E |
| EBIT (Adj) | 3,033 | 1,663 | 1,987 | 1,981 | 2,263 | EBITDA | 3,349 | 1,947 | 2,280 | 2,276 | 2,560 |
| EBIT Margin (Adj) (%) | 10.2 | 6.2 | 8.1 | 7.6 | 8.1 | Working capital | -193 | 1,000 | 788 | -324 | -271 |
| Net interest | -134 | -89 | -72 | -20 | 0 | Other | -918 | -505 | -312 | 57 | 68 |
| Associates | 0 | 0 | 0 | 0 | 0 | Operating cashflow | 2,237 | 2,441 | 2,756 | 2,009 | 2,358 |
| Non-Op/Except/Other Adj | -3,632 | 15 | 222 | 751 | 845 | Capex | -110 | -95 | -300 | -300 | -300 |
| Pre-tax profit | -733 | 1,589 | 2,137 | 2,712 | 3,108 | Net acq/disposals | -216 | 91 | 0 | 0 | 0 |
| Tax | -34 | -373 | -532 | -672 | -767 | Other | -1 | 7 | -13 | -13 | -13 |
| Extraord./Min.Int./Pref.div. | 67 | -16 | -16 | -16 | -16 | Investing cashflow | -328 | 2 | -313 | -313 | -313 |
| Reported net profit | -699 | 1,200 | 1,590 | 2,024 | 2,325 | Dividends paid | -1,794 | -1,196 | -982 | -1,250 | -1,436 |
| Net Margin (%) | -2.4 | 4.5 | 6.5 | 7.7 | 8.3 | Financing cashflow | -1,782 | -2,515 | -865 | -1,094 | -1,237 |
| CoreNPAT | -699 | 1,200 | 1,590 | 2,024 | 2,325 | Net change in cash | 181 | -64 | 1,577 | 602 | 807 |
| Per share data | 2024 | 2025 | 2026E | 2027E | 2028E | Free cashflow to s/holders | 2,127 | 2,346 | 2,456 | 1,709 | 2,058 |
| Reported EPS($) | -2.34 | 4.01 | 5.32 | 6.77 | 7.78 | ||||||
| Core EPS($) | -2.34 | 4.01 | 5.32 | 6.77 | 7.78 | ||||||
| DPS($) | 4.00 | 2.48 | 3.28 | 4.18 | 4.80 | ||||||
| CFPS($) | 7.48 | 8.17 | 9.22 | 6.72 | 7.89 | ||||||
| 7.11 | 8.21 | 5.72 | |||||||||
| FCFPS($) | 7.85 | 6.88 | |||||||||
| Wtdavgordshares(m) | 299 | 299 | 299 | 299 | 299 | ||||||
| Wtdavgdiluted shares (m) | 299 | 299 | 299 | 299 | 299 | ||||||
| Growthrates | 2024 | 2025 | 2026E | 2027E | 2028E | ||||||
| Sales revenue (%) | 8.7 | -9.7 | -8.4 | 6.6 | 6.8 | ||||||
| EBIT (Adj) (%) | -10.4 | -45.2 | 19.5 | -0.3 | 14.2 | ||||||
| CoreNPAT(%) | -141.3 | 271.7 | 32.4 | 27.3 | 14.9 | ||||||
| CoreEPS(%) | -141.3 | 271.7 | 32.4 | 27.3 | 14.9 | ||||||
| BalanceSheet(NT$m) | 2024 | 2025 | 2026E | 2027E | 2028E | ||||||
| Cash&cashequiv. | 3,698 | 3,612 | 5,189 | 5,791 | 6,598 | ||||||
| Accounts receivables | 2,660 | 3,036 | 2,608 | 2,781 | 2,969 | ||||||
| Inventory | 10,721 | 8,469 | 8,178 | 8,509 | 8,741 | ||||||
| Net fixed &other tangibles | 3,757 | 2,898 | 2,919 | 2,937 | 2,953 | ||||||
| Goodwill &intangibles | 51 | 38 | 38 | 38 | 38 | ||||||
| Financial &other assets | 16,695 | 17,150 | 16,975 | 17,022 | 17,074 | ||||||
| Total assets | 37,582 | 35,203 | 35,908 | 37,078 | 38,373 | ||||||
| Accounts payable | 4,149 | 3,044 | 3,114 | 3,444 | |||||||
| Short-term debt | 7,341 | 7,155 | 7,155 | 3,294 7,155 | 7,155 | ||||||
| Long-term debt | 912 | 318 | 318 | 318 | |||||||
| Provisions &other liab | 4,898 | 4,862 | 4,756 | 4,801 | 318 4,842 | ||||||
| 17,300 | 15,380 | 15,343 | 15,568 | 15,758 | |||||||
| Total liabilities | 19,393 | ||||||||||
| Shareholders' equity | 19,295 | 430 | 20,121 | 21,054 | 22,146 469 | ||||||
| Minority interests Total equity | 987 20,282 | 19,823 | 443 20,564 | 456 21,510 | 22,615 | ||||||
| Net debt (Adj) | 4,555 | 3,861 | 2,284 | 1,682 | 875 | ||||||
| Net debt to equity (Adj) (%) | 22.5 | 19.5 | |||||||||
| For definitions of the items in this | please click here. | 11.1 | 7.8 | 3.9 |
Prepared for Kevin Lu
EU: recovering as inventories normalized -EU subsidiaries' 1H26 sales were up 14% y/y and profit grew >45% y/y, supported by normalized channel inventories and new product launches. Mgmt. is seeing a recovery across both conventional road bikes and e-bikes, although the broader recovery remains gradual. EU subsidiaries generated an avg GPM of 24-25% in 1H26.
Implications -We raise our 2026-28E earnings forecasts by 3-5%, mainly to incorporate stronger gross margin in Merida's core business, supported by a better product mix, fewer discounted products, and improving profitability at its EU subsidiaries. We also factor in better China OBM sales and a gradual EU market recovery. We trim our non-op income for 2026-2028E to factor in SBC miss in 2Q26.
We lift our TP to NT$93 based on 15.5x 2H26-1H27E EPS. Our target multiple is 40% below its historical average, reflecting limited visibility into SBC's profitability, still soft OEM and e-bike shipment and the group's sales decline expected in 2026E.
We maintain our Neutral rating as we see limited near-term catalysts following the strong 2Q margin performance. A more constructive view would require clearer evidence of sustainable SBC net profitability, stronger OEM orders or better sellthrough from upcoming product launches.
Figure 1. Merida: Earnings Estimates Revision
| 2026E | 2026E | 2026E | 2027E | 2027E | 2027E | 2028E | 2028E | 2028E | |
|---|---|---|---|---|---|---|---|---|---|
| NT$ mn | New | Old | Chg | New | Old | Chg | New | Old | Chg |
| Revenue | 24,505 | 23,866 | 3% | 26,129 | 25,722 | 2% | 27,896 | 27,669 | 1% |
| Gross profit | 4,249 | 3,586 | 19% | 4,315 | 3,962 | 9% | 4,671 | 4,284 | 9% |
| OPEX | 2,262 | 2,001 | 13% | 2,334 | 2,079 | 12% | 2,408 | 2,153 | 12% |
| Operating profit | 1,987 | 1,585 | 25% | 1,981 | 1,883 | 5% | 2,263 | 2,131 | 6% |
| Pre-tax profit | 2,137 | 2,076 | 3% | 2,712 | 2,615 | 4% | 3,108 | 2,956 | 5% |
| Net profit | 1,590 | 1,544 | 3% | 2,024 | 1,951 | 4% | 2,325 | 2,211 | 5% |
| Basic EPS (NT$) | 5.32 | 5.16 | 3% | 6.77 | 6.53 | 4% | 7.78 | 7.39 | 5% |
| Ratio | New | Old | diff | New | Old | diff | New | Old | diff |
| Gross margin (%) | 17.3 | 15.0 | 2.3 | 16.5 | 15.4 | 1.1 | 16.7 | 15.5 | 1.3 |
| OPEX to Sales ratio (%) | 9.2 | 8.4 | 0.9 | 8.9 | 8.1 | 0.9 | 8.6 | 7.8 | 0.8 |
| Operating margin (%) | 8.1 | 6.6 | 1.5 | 7.6 | 7.3 | 0.3 | 8.1 | 7.7 | 0.4 |
| Net margin (%) | 6.5 | 6.5 | 0.0 | 7.7 | 7.6 | 0.2 | 8.3 | 8.0 | 0.3 |
© 2026 Citigroup Inc. No redistribution without Citigroup's written permission.
Source: Citi Research, Citi Research Estimates
NT$
120
100
80
60
40
Aug 25
• Target P/E of 19x
• 42% Upside
NT$ 93.00
A 12% Upside
Bull/Bear: Merida (9914.TW)
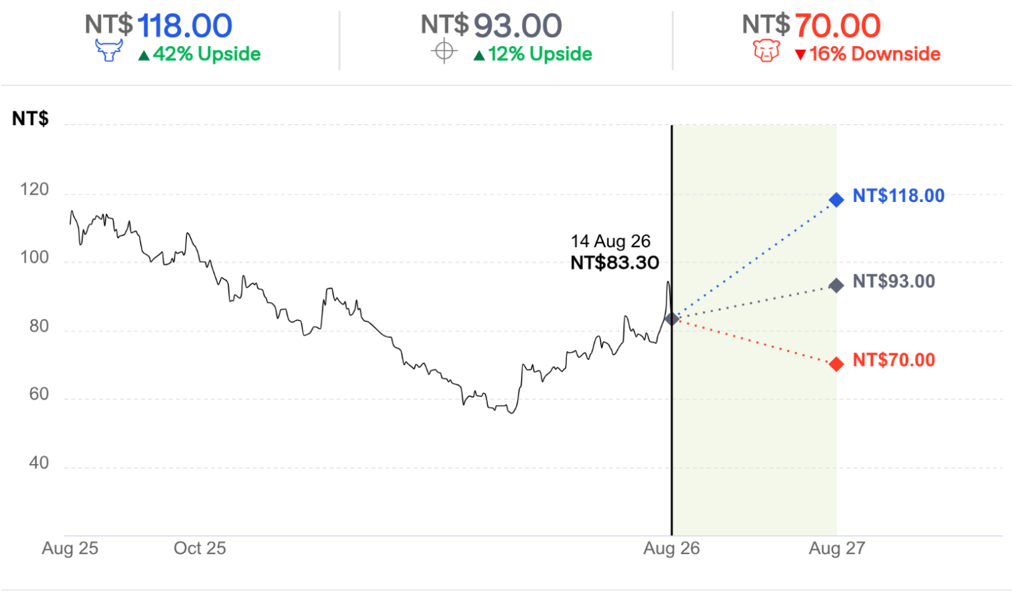
BASE Assumptions
Sales decrease of 8-10% yoy in 2026E
• GPM of 16-17% in 2026E
• Target P/E of 15.5x
BEAR Assumptions
- 45 ' Sales decrease of 10-15% yoy in 2026E
• GPM of 15-16% in 2026E
• Target P/E of 13x
Prepared for Kevin Lu
NT$ 70.00
• 16% Downside
Prepared for Kevin Lu
Merida
Company description
Merida is the second-largest bike manufacturer in Taiwan. Founded in 1972, Merida was initially involved in OEM manufacturing before it started marketing bikes under its own Merida brand in 1986. Merida has expanded its footprint globally through its Merida brand and three OEM brands: Specialized (in which Merida has a 35% stake), Centurion (51% stake), and Miyata (45%). Merida's own brand contributes around 30-40% of total revenues. Merida has established a proprietary network of stores throughout China, with 16 wholly owned subsidiaries and close to 2,000 retailers that sell only Merida-branded bikes.
Investment strategy
We rate Merida shares as Neutral. Although bike inventories have normalised in the major markets after aggressive clearance over the past 2 years, slowerthan-expected bike demand recovery continues to weigh on Merida's topline momentum. The EU market appears to be where we should see better growth for 2026E, while China market also turns better than expected from 2Q26; yet with low visibility of SBC profit trend and limited positive catalysts in sight, we expect the share price to be range bound.
Valuation
Our target price for Merida shares of NT$93 is based on a 2H26-1H27E P/E of 15.5x, a 30% discount to its historical average of 22x during pre-Covid years (2014-2019), in view of soft order momentum as a result of slow recovery in bike demand, a volatile margin trend, and low visibility of SBC.
Risks
Downside risks that could mean the Merida shares trade below our target price include: 1) e-bike adoption slower than expected; 2) weaker restocking demand; 3) lukewarm sell-through at SBC; and 4) a weaker macro.
Upside risks that could mean the Merida shares trade above our target price include: 1) e-bike adoption faster than expected; 2) stronger restocking demand; 3) stronger sell-through at SBC; and 4) a strong macro.
If you are visually impaired and would like to speak to a Citi representative regarding the details of the graphics in this document, please call USA 1-888-500-5008 (TTY: 711), from outside the US +1-210-677-3788