PDF 原檔:報告_Citi_研華2395_20260806_original.pdf
圖片清單(已驗證 2026-08-07)
| 檔名 | size | 分類 | 親眼所見內容 |
|---|---|---|---|
報告_Citi_研華2395_20260806_001.png |
17.7KB | 裝飾·logo·banner | <40KB 未逐張細驗,為 Price Performance 小圖,預設略過 |
報告_Citi_研華2395_20260806_002.png |
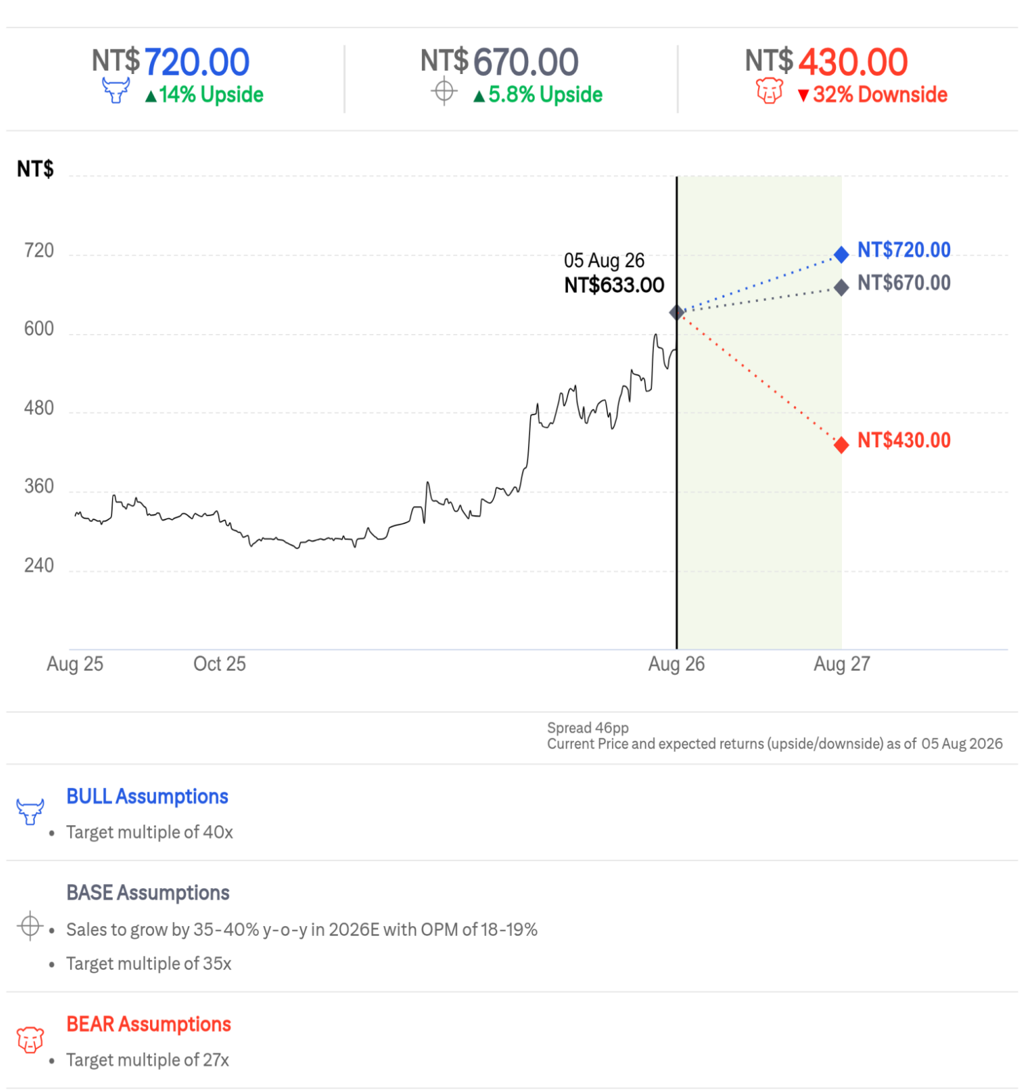
161.7KB | 真資料圖 | Bull/Base/Bear 目標價情境圖:Bull NT$720(+14%,40x)、Base NT$670(+5.8%,35x,銷售35-40%成長+OPM 18-19%)、Bear NT$430(-32%,27x),股價走勢至 2026-08-05 收盤 NT$633 |
報告_Citi_研華2395_20260806_003.png |
255.3KB | 真資料圖 | Citi Ratings and Target Price History 與 Short-Term View/Catalyst Watch 附錄圖表:2023-08 至 2026-05 評等/目標價變動紀錄(含日期、TP、收盤價) |
原始內容
(RIC: 2395.IW, BB: 2395 11)
TWD
650
600
550
500
450
400
350
300
250
06 Aug 2026 09:47:06 ET │ 14 pages
Sep
Dec
Mar
Jun
Advantech (2395.TW)
Strong Demand and Record Order in July, Yet Rich Valuation Caps Upside
CITI'S TAKE
Advantech hosted its 2Q26 briefing on Aug 5 th . The mgmt. indicated demand momentum remains healthy with July bookings hitting a record figure and group BB ratio improving to 1.6x from 1.4x in 2Q26. 3Q26 sales are estimated to grow both q/q and y/y, driven by solid strength from semi, cloud infra, and factory automation demand. However, shortages of key components remain a near-term constraint, while higher component costs are being passed through partly. We increase our 2026-28E EPS 27-34% and lift our TP to NT$670 (35x NTM P/E). Maintain Neutral as the rich valuation appears to have priced in much of the improving demand outlook.
Regional and segment recovery remained broad-based -2Q26 results beat on broad-based growth and strong operating leverage. Of the 33% y/y 2Q26 sales growth in USD term, the mgmt. attributed to 20ppt to volume growth and 13ppt to price increases. In 1H26, NA grew 30% y/y (in USD terms), driven by semi equipment, robotics, and cloud infra. EU increased 29% y/y, supported by medical, and factory automation, while China rose 51% y/y on stronger channel sales, semi and robotics projects.
Strong July bookings indicate a solid 2H outlook -The group's 2Q26 BB ratio remained strong at 1.4x, including 1.9x in NA, 1.3x in EU and 1.2x in China. July bookings reached a record US$570mn, lifting the monthly BB ratio to 1.6x and suggesting that demand momentum remains solid entering 3Q driven by the ongoing strength in edge AI computing in various end applications. The mgmt. expects 3Q26E sales to be up q/q and y/y, with GPM and OPM broadly stable q/q.
Component shortages remain the key execution risk -Per mgmt., PCB and CCL supply remains particularly tight, while DDR4 and SSD availability has improved but it not yet normalized. CPUs and PMICs also remain constrained, with extended lead times. Advantech expects 3Q material availability to remain manageable through early procurement, although PCB procurement would remain challenging in the coming quarter. A second round of price increases is underway, particularly for commodity-related products but the pass-through will be gradual; hence, meaningful GPM recovery may require component inflation to ease. (continued)
Earnings Summary
| Year to 31Dec | Net Profit (NT$M) | DilutedEPS (NT$) | EPSgrowth (%) | P/E (x) | P/B (x) | ROE (%) | Yield (%) |
|---|---|---|---|---|---|---|---|
| 2024A | 9,005 | 10.46 | -19.2 | 60.5 | 10.6 | 18 | 1.3 |
| 2025A | 10,593 | 12.26 | 17.2 | 51.6 | 10 | 19.9 | 1.4 |
| 2026E | 16,374 | 18.87 | 54 | 33.5 | 9.7 | 29.4 | 2.2 |
| 2027E | 17,626 | 20.3 | 7.6 | 31.2 | 8.7 | 29.5 | 2.3 |
| 2028E | 19,515 | 22.48 | 10.7 | 28.2 | 7.8 | 29.2 | na |
Source: Powered by dataCentral
See Appendix A-1 for Analyst Certification, Important Disclosures and Research Analyst Affiliations.
| n Neutral | |
|---|---|
| Price(05Aug2613:30) | NT$633.00 |
| Target price | NT$670.00↑ |
| fromNT$405.00 Expected share price return | 5.8% |
| Expected dividend yield | 2.2% |
| Expected total return | 8.0% |
| MarketCap | NT$549,605M |
| US$17,028M |
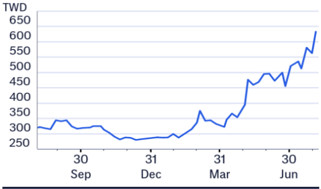
Price Performance (RIC: 2395.TW, BB: 2395 TT)
Angela Hsu AC
+886-2-8726-9083 angela.hc.hsu@citi.com
Citi Research
See Appendix A-1 for Analyst Certification, Important Disclosures and Research Analyst Affiliations.
| 2395.TW: | Fiscalyearend31-Dec | Price:NT$633.00; TP:NT$670.00; MarketCap:NT$549,605m; Recomm:Neutral | Price:NT$633.00; TP:NT$670.00; MarketCap:NT$549,605m; Recomm:Neutral | Price:NT$633.00; TP:NT$670.00; MarketCap:NT$549,605m; Recomm:Neutral | Price:NT$633.00; TP:NT$670.00; MarketCap:NT$549,605m; Recomm:Neutral | Price:NT$633.00; TP:NT$670.00; MarketCap:NT$549,605m; Recomm:Neutral | |||||
|---|---|---|---|---|---|---|---|---|---|---|---|
| Profit&Loss(NT$m) | 2024 | 2025 | 2026E | 2027E | 2028E | Valuation ratios | 2024 | 2025 | 2026E | 2027E | 2028E |
| Sales revenue | 59,786 | 70,882 | 97,828 | 106,409 | 116,736 | PE(x) | 60.5 | 51.6 | 33.5 | 31.2 | 28.2 |
| Cost of sales | -35,410 | -42,685 | -60,406 | -64,636 | -70,709 | PB(x) | 10.6 | 10.0 | 9.7 | 8.7 | 7.8 |
| Gross profit | 24,376 | 28,198 | 37,422 | 41,773 | 46,027 | EV/EBITDA(x) | 51.5 | 40.8 | 26.4 | 24.1 | 21.6 |
| Gross Margin (%) | 40.8 | 39.8 | 38.3 | 39.3 | 39.4 | FCFyield (%) | 1.3 | 1.4 | 2.7 | 2.9 | 3.4 |
| EBITDA(Adj) | 9,984 | 12,559 | 19,429 | 21,178 | 23,328 | Dividend yield (%) | 1.3 | 1.4 | 2.2 | 2.3 | na |
| EBITDAMargin(Adj) (%) | 16.7 | 17.7 | 19.9 | 19.9 | 20.0 | Payout ratio (%) | 80 | 73 | 73 | 73 | 0 |
| Depreciation | -934 | -992 | -1,072 | -1,083 | -1,083 | ROE(%) | 18.0 | 19.9 | 29.4 | 29.5 | 29.2 |
| Amortisation | 0 | 0 | 0 | 0 | 0 | Cashflow(NT$m) | 2024 | 2025 | 2026E | 2027E | 2028E |
| EBIT (Adj) | 9,050 | 11,567 | 18,357 | 20,095 | 22,245 | EBITDA | 9,984 | 12,559 | 19,429 | 21,178 | 23,328 |
| EBIT Margin (Adj) (%) | 15.1 | 16.3 | 18.8 | 18.9 | 19.1 | Working capital | -1,136 | -406 | -874 | -1,605 | -980 |
| Net interest | 294 | 252 | 312 | 314 | 453 | Other | -162 | -1,066 | -2,043 | -2,527 | -2,788 |
| Associates | -176 | -102 | 467 | 175 | 175 | Operating cashflow | 8,686 | 11,086 | 16,512 | 17,046 | 19,560 |
| Non-Op/Except/Other Adj | 1,807 | 972 | 642 | 700 | 700 | Capex | -1,852 | -3,200 | -1,928 | -1,000 | -1,000 |
| Pre-tax profit | 10,975 | 12,690 | 19,779 | 21,284 | 23,573 | Net acq/disposals | -125 | -97 | -1,194 | -175 | -175 |
| Tax | -2,086 | -2,189 | -3,464 | -3,716 | -4,116 | Other | -829 | -1,375 | -912 | 0 | 0 |
| Extraord./Min.Int./Pref.div. | 117 | 92 | 60 | 59 | 59 | Investing cashflow | -2,806 | -4,672 | -4,034 | -1,175 | -1,175 |
| Reported net profit | 9,005 | 10,593 | 16,374 | 17,626 | 19,515 | Dividends paid | -8,120 | -7,252 | -7,740 | -11,965 | -12,880 |
| Net Margin (%) | 15.1 | 14.9 | 16.7 | 16.6 | 16.7 | Financing cashflow | -5,983 | -7,473 | -14,480 | -11,072 | -11,897 |
| CoreNPAT | 9,005 | 10,593 | 16,374 | 17,626 | 19,515 | Net change in cash | -102 | -1,059 | -2,002 | 4,799 | 6,488 |
| Per share data | 2024 | 2025 | 2026E | 2027E | 2028E | Free cashflow to s/holders | 6,834 | 7,886 | 14,584 | 16,046 | 18,560 |
| Reported EPS($) | 10.46 | 12.26 | 18.87 | 20.30 | 22.48 | ||||||
| Core EPS($) | 10.46 | 12.26 | 18.87 | 20.30 | 22.48 | ||||||
| DPS($) | 8.40 | 8.94 | 13.77 | 14.82 | 0 | ||||||
| CFPS($) | 10.09 | 12.83 | 19.03 | 19.63 | 22.53 | ||||||
| FCFPS($) | 7.94 | 9.13 | 16.81 | 18.48 | 21.38 | ||||||
| BVPS($) | 59.55 | 63.46 | 65.10 | 72.57 | 81.27 | ||||||
| Wtdavgordshares(m) | 861 | 864 | 868 | 868 | 868 | ||||||
| Wtdavgdiluted shares (m) | 861 | 864 | 868 | 868 | 868 | ||||||
| Growthrates | 2024 | 2025 | 2026E | 2027E | 2028E | ||||||
| Sales revenue (%) | -7.4 | 18.6 | 38.0 | 8.8 | 9.7 | ||||||
| EBIT (Adj) (%) | -25.4 | 27.8 | 58.7 | 9.5 | 10.7 | ||||||
| CoreNPAT(%) | -16.9 | 17.6 | 54.6 | 7.6 | 10.7 | ||||||
| CoreEPS(%) | -19.2 | 17.2 | 54.0 | 7.6 | 10.7 | ||||||
| BalanceSheet(NT$m) | 2024 | 2025 | 2026E | 2027E | 2028E | ||||||
| Cash&cashequiv. | 19,528 | 18,470 | 16,467 | 21,267 | 27,754 | ||||||
| Accounts receivables | 10,124 | 10,535 | 15,329 | 17,604 | 19,335 | ||||||
| Inventory | 10,554 | 11,835 | 15,752 | 17,923 | 19,679 | ||||||
| Net fixed &other tangibles | 12,244 | 14,452 | 15,308 | 15,225 | 15,142 | ||||||
| Goodwill &intangibles | 0 | 0 | 0 | 0 | 0 | ||||||
| Financial &other assets | 19,292 | 20,426 | 23,229 | 23,615 | 24,043 | ||||||
| Total assets | 71,742 | 75,718 | 86,085 | 95,635 | 105,952 | ||||||
| Accounts payable | 6,911 | 7,681 | 10,778 | 12,546 | 13,775 | ||||||
| Short-term debt | 0 | 0 | 0 | 0 | 0 | ||||||
| Long-term debt | 156 | 150 | 0 | 0 | 0 | ||||||
| Provisions &other liab | 12,878 | 12,837 | 18,614 | 19,899 | 21,428 | ||||||
| Total liabilities | 19,945 | 20,668 | 29,391 | 32,446 | 35,203 | ||||||
| Shareholders' equity | 51,428 | 54,947 | 56,574 | 63,070 | 70,630 | ||||||
| Minority interests | 369 | 102 | 119 | 119 | 119 | ||||||
| Total equity | 51,797 | 55,049 -18,319 | 56,693 | 63,189 | 70,749 | ||||||
| Net debt (Adj) | -19,372 | -16,467 | -21,267 | -27,754 | |||||||
| Net debt to equity (Adj) (%) | -37.4 | -33.3 | -33.7 | -39.2 | |||||||
| For definitions of the items in this table, | please click here. | -29.0 |
Click here to type Chapter Heading
Click here to type text
Click here to type Heading
Implications -We raise our 2026-2028E sales estimates 17-22% and EPS forecasts by 27-34%, reflecting strong 2Q results, record bookings and management's constructive guidance. Our new TP of NT$670 is based on 35x 2H26-1H27E P/E, sitting at the higher end of its historical range, reflecting its solid demand outlook, improving OPM and ROE trend. While we remain positive on Advantech's leadership in industrial computing and edge AI, we remain Neutral given the stock's strong rally, premium valuation and lingering component-cost pressures.
Figure 1. Earnings Estimates Revisions
| 2026E | 2026E | 2026E | 2027E | 2027E | 2027E | 2028E | 2028E | 2028E | |
|---|---|---|---|---|---|---|---|---|---|
| (NT$mn) | New | Old | Chg. | New | Old | Chg. | New | Old | Chg. |
| Sales | 97,828 | 80,296 | 22% | 106,409 | 89,498 | 19% | 116,736 | 99,790 | 17% |
| Gross profit | 37,422 | 31,445 | 19% | 41,773 | 35,540 | 18% | 46,027 | 39,864 | 15% |
| Opex | 19,065 | 17,967 | 6% | 21,678 | 20,376 | 6% | 23,782 | 22,720 | 5% |
| Operatingprofit | 18,357 | 13,478 | 36% | 20,095 | 15,164 | 33% | 22,245 | 17,144 | 30% |
| Pre-tax profit | 19,779 | 14,778 | 34% | 21,284 | 16,504 | 29% | 23,573 | 18,594 | 27% |
| Netincome | 16,374 | 12,188 | 34% | 17,626 | 13,606 | 30% | 19,515 | 15,322 | 27% |
| EPS(NT$) | 18.87 | 14.10 | 34% | 20.30 | 15.74 | 29% | 22.48 | 17.72 | 27% |
| Margins (%) | |||||||||
| Gross margin | 38.3 | 39.2 | -0.9 | 39.3 | 39.7 | -0.5 | 39.4 | 39.9 | -0.5 |
| Opexratio | 19.5 | 22.4 | -2.9 | 20.4 | 22.8 | -2.4 | 20.4 | 22.8 | -2.4 |
| Operatingmargin | 18.8 | 16.8 | 2.0 | 18.9 | 16.9 | 1.9 | 19.1 | 17.2 | 1.9 |
| Netmargin | 16.7 | 15.2 | 1.6 | 16.6 | 15.2 | 1.4 | 16.7 | 15.4 | 1.4 |
© 2026 Citigroup Inc. No redistribution without Citigroup's written permission.
Source: Citi Research, Citi Research Estimates
NT$
720
600
480
360
240
Aug 25
NT$ 670.00
Bull/Bear: Advantech (2395.TW)
NT$ 430.00
v 32% Downside
Advantech
Company description
Advantech, established in 1981, is the largest Industrial PC company globally in terms of sales. Through a series of M&As and alliances, it has established strong domain know-how across various verticals and its diversified customer base, and it provides broad product offerings ranging from single boards, industrial handheld devices, industrial automation equipment, transportation controlling systems, and smart city solutions. North America and China are its largest markets.
Investment strategy
We rate Advantech shares at Neutral. We think the company's relatively stable margins and improving ROE, as well as demand recovery from major markets should help support the share price performance. However, as these catalysts are likely reflected in the price, we think further upside would take a more broad-based demand recovery to justify.
Valuation
Our target price of NT$670 is based on 35x 2H26-1H27E EPS, at the highcycle of the stock's valuation range between 20-35x since 2020, reflecting solid BB ratio, improving margin profile and ROE.
Risks
Key upside risks that could cause Advantech's shares to trade above our target price include: 1) better-than-expected marcoeconomic outlook; and 2) better-than-expected demand and margin profile. Key downside risks would include: 1) slower-than-expected demand recovery, especially the China market; and 2) further deterioration of demand in US and EU markets.
If you are visually impaired and would like to speak to a Citi representative regarding the details of the graphics in this document, please call USA 1-888-500-5008 (TTY: 711), from outside the US +1-210-677-3788