PDF 原檔:報告_Citi_儒鴻1476_20260818_original.pdf
圖片清單(已驗證 2026-08-19)
分類為「真資料圖」者才可嵌入 lib/ 頁,圖說須照抄下表「親眼所見內容」。標「未驗證」者一律不得嵌入;若日後需要,須先逐張 Read 現場補驗。
| 檔名 | size | 分類 | 親眼所見內容 |
|---|---|---|---|
報告_Citi_儒鴻1476_20260818_003.png |
255KB | 裝飾·logo·banner | Citi 對儒鴻 1476.TW 的評等與目標價歷史圖(2024–2026)+短線觀點/Catalyst Watch 歷史圖與明細表,分析師 Angela Hsu |
報告_Citi_儒鴻1476_20260818_001.png/_002.png |
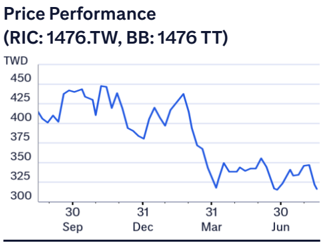
29KB/98KB | 未驗證 | 未逐張 Read(圖說標示為 Price Performance 與 Bull/Bear 情境圖),不得嵌入 lib |
原始內容
(RIC: 14/6.IW, BB: 14(6 11)
TWD
450
425
400
375
350
325
300
Prepared for Kevin Lu
30
18 Aug 2026 09:52:24 ET │ 13 pages
Sep
Dec
Mar
Jun
Eclat (1476.TW)
2Q26 Briefing - Constructive 2H Outlook; Easing Input Costs and Healthy New Product Momentum
CITI'S TAKE
We came away from Eclat's 2Q26 briefing with a constructive view on the 2H26 demand outlook, supported by six months of order visibility, healthy new product development activity, and new customer wins. Raw material headwinds should ease sequentially from 3Q as oil prices normalize and price negotiation progress. We slightly trim our earnings estimates 2-3% to factor in 2Q26 results. We reiterate Buy with an unchanged TP of NT$460 (17x NTM P/E). With fundamentals turning more positive h/h, we think at 11.5x NTM P/E, near the low end of its historical range, downside appears limited with a 6% dividend yield providing additional valuation support.
2H26 outlook remains constructive with 6-month visibility -Mgmt. reiterated that order visibility remains 6 months and noted that monthly sales of >NT$3bn is achievable. Looking further ahead, mgmt. also maintains a cautiously optimistic view on 1H27E, indicating that despite potential uncertainties from geo tension and macro conditions, product development requests, customer engagement and longterm order discussion remain active.
New product momentum stays healthy; wellness contribution at ~15% -New product development remains one of the more encouraging messages from the briefing. Mgmt. highlighted that: 1) wellness products account for ~15% of sales and continue to receive good market feedback, 2) brand customers continue to invest in product innovation at a healthy pace, 3) new product development and launch ratios continue to trend upward, and 4) Eclat is currently developing products with three new brand customers. One has already started placing orders while the other two remain under development.
Margin pressure should ease in 3Q; product mix remains the key swing factor -2Q GPM declined q/q mainly due to higher raw material costs and an unfavorable mix, as stronger-than-expected carry-over product demand diluted the margin benefit from new products. Mgmt. expects raw material pressure to ease in 3Q, supported by lower oil prices and ongoing customer price negotiations. The pace of margin recovery will still depend on the mix between new and carry-over products. Mgmt. will continue to target >30% GPM in 2H26E. (continued)
Earnings Summary
| Year to 31Dec | Net Profit (NT$M) | DilutedEPS (NT$) | EPSgrowth (%) | P/E (x) | P/B (x) | ROE (%) | Yield (%) |
|---|---|---|---|---|---|---|---|
| 2024A | 6,641 | 24.2 | 28.3 | 12.8 | 2.9 | 24.3 | 5.5 |
| 2025A | 5,515 | 20.1 | -17 | 15.4 | 2.9 | 18.8 | 4.8 |
| 2026E | 7,009 | 25.55 | 27.1 | 12.2 | 3.1 | 24.6 | 6.1 |
| 2027E | 7,778 | 28.35 | 11 | 11 | 2.9 | 27.4 | 6.8 |
| 2028E | 8,876 | 32.35 | 14.1 | 9.6 | 2.7 | 29.1 | 7.8 |
Source: Powered by dataCentral
See Appendix A-1 for Analyst Certification, Important Disclosures and Research Analyst Affiliations.
n Buy
Short-Term View: Upside, expires 06-SEP-26
| Price (18Aug2613:30) | NT$310.50 |
|---|---|
| Target price | NT$460.00 |
| Expected share price return | 48.1% |
| Expected dividend yield | 5.8% |
| Expected total return | 53.9% |
| MarketCap | NT$85,191M |
| US$2,673M |
Price Performance
(RIC: 1476.TW, BB: 1476 TT)
Angela Hsu AC
+886-2-8726-9083 angela.hc.hsu@citi.com
Prepared for Kevin Lu
| 1476.TW: Fiscalyearend31-Dec | Price: NT$310.50; TP:NT$460.00; Market Cap: NT$85,191m; Recomm:Buy | Price: NT$310.50; TP:NT$460.00; Market Cap: NT$85,191m; Recomm:Buy | Price: NT$310.50; TP:NT$460.00; Market Cap: NT$85,191m; Recomm:Buy | Price: NT$310.50; TP:NT$460.00; Market Cap: NT$85,191m; Recomm:Buy | Price: NT$310.50; TP:NT$460.00; Market Cap: NT$85,191m; Recomm:Buy | ||||||
|---|---|---|---|---|---|---|---|---|---|---|---|
| Profit&Loss(NT$m) | 2024 | 2025 | 2026E | 2027E | 2028E | Valuation ratios | 2024 | 2025 | 2026E | 2027E | 2028E |
| Sales revenue | 36,828 | 37,990 | 41,441 | 46,322 | 51,785 | PE(x) | 12.8 | 15.4 | 12.2 | 11.0 | 9.6 |
| Cost of sales | -25,460 | -27,108 | -28,565 | -31,609 | -34,981 | PB(x) | 2.9 | 2.9 | 3.1 | 2.9 | 2.7 |
| Gross profit | 11,369 | 10,882 | 12,877 | 14,713 | 16,804 | EV/EBITDA(x) | 9.0 | 10.7 | 8.4 | 7.4 | 6.4 |
| Gross Margin (%) | 30.9 | 28.6 | 31.1 | 31.8 | 32.4 | FCFyield (%) | 5.0 | 8.5 | 7.2 | 7.3 | 8.6 |
| EBITDA(Adj) | 9,199 | 7,743 | 9,727 | 10,988 | 12,668 | Dividend yield (%) | 5.5 | 4.8 | 6.1 | 6.8 | 7.8 |
| EBITDAMargin(Adj) (%) | 25.0 | 20.4 | 23.5 | 23.7 | 24.5 | Payout ratio (%) | 70 | 75 | 75 | 75 | 75 |
| Depreciation | -886 | -876 | -924 | -1,041 | -1,166 | ROE(%) | 24.3 | 18.8 | 24.6 | 27.4 | 29.1 |
| Amortisation | 0 | 0 | 0 | 0 | 0 | Cashflow(NT$m) | 2024 | 2025 | 2026E | 2027E | 2028E |
| EBIT (Adj) | 7,755 | 7,092 | 8,665 | 10,016 | 11,566 | EBITDA | 8,642 | 7,968 | 9,588 | 11,057 | 12,732 |
| EBIT Margin (Adj) (%) | 21.1 | 18.7 | 20.9 | 21.6 | 22.3 | Working capital | -2,365 | 1,283 | -1,320 | -965 | -1,078 |
| Net interest | 96 | 99 | 130 | 84 | 84 | Other | -1,556 | -1,681 | -1,187 | -2,239 | -2,690 |
| Associates | 0 | 0 | 0 | 0 | 0 | Operating cashflow | 4,720 | 7,570 | 7,082 | 7,854 | 8,965 |
| Non-Op/Except/Other Adj | 499 | -225 | 140 | -69 | -64 | Capex | -484 | -370 | -948 | -1,600 | -1,600 |
| Pre-tax profit | 8,351 | 6,966 | 8,934 | 10,031 | 11,586 | Net acq/disposals | 0 | 0 | 0 | 0 | 0 |
| Tax | -1,710 | -1,451 | -1,925 | -2,254 | -2,710 | Other | -307 | -1,497 | 56 | 0 | 0 |
| Extraord./Min.Int./Pref.div. | 0 | 0 | 0 | 0 | 0 | Investing cashflow | -792 | -1,866 | -891 | -1,600 | -1,600 |
| Reported net profit | 6,641 | 5,515 | 7,009 | 7,778 | 8,876 | Dividends paid | -3,704 | -4,664 | -5,231 | -5,804 | -6,624 |
| Net Margin (%) | 18.0 | 14.5 | 16.9 | 16.8 | 17.1 | Financing cashflow | -3,109 | -5,854 | -5,542 | -5,804 | -6,624 |
| CoreNPAT | 6,641 | 5,515 | 7,009 | 7,778 | 8,876 | Net change in cash | 804 | -209 | 693 | 450 | 741 |
| Per share data | 2024 | 2025 | 2026E | 2027E | 2028E | Free cashflow to s/holders | 4,236 | 7,200 | 6,134 | 6,254 | 7,365 |
| Reported EPS($) | 24.20 | 20.10 | 25.55 | 28.35 | 32.35 | ||||||
| Core EPS($) | 24.20 | 20.10 | 25.55 | 28.35 | 32.35 | ||||||
| DPS($) | 17.00 | 15.00 | 19.06 | 21.15 | 24.14 | ||||||
| CFPS($) | 17.20 | 27.59 | 25.81 | 28.62 | 32.68 | ||||||
| FCFPS($) | 15.44 | 26.24 | 22.36 | 22.79 | 26.84 | ||||||
| BVPS($) | 105.41 | 108.02 | 99.90 | 107.10 | 115.30 | ||||||
| Wtdavgordshares(m) | 274 | 274 | 274 | 274 | 274 | ||||||
| Wtdavgdiluted shares (m) | 274 | 274 | 274 | 274 | 274 | ||||||
| Growthrates | 2024 | 2025 | 2026E | 2027E | 2028E | ||||||
| Sales revenue (%) | 19.6 | 3.2 | 9.1 | 11.8 | 11.8 | ||||||
| EBIT (Adj) (%) | 18.4 | -8.6 | 22.2 | 15.6 | 15.5 | ||||||
| CoreNPAT(%) | 28.3 | -17.0 | 27.1 | 11.0 | 14.1 | ||||||
| CoreEPS(%) | 28.3 | -17.0 | 27.1 | 11.0 | 14.1 | ||||||
| BalanceSheet(NT$m) | 2024 | 2025 | 2026E | 2027E | 2028E | ||||||
| Cash&cashequiv. | 3,618 | 3,409 | 4,102 | 4,552 | 5,293 | ||||||
| Accounts receivables | 6,553 | 3,097 | 4,177 | 4,691 | 5,267 | ||||||
| Inventory | 5,522 | 5,931 | 6,659 | 7,399 | 8,220 | ||||||
| Net fixed &other tangibles | 14,357 | 13,670 | 13,820 | 14,379 | 14,813 | ||||||
| Goodwill &intangibles | 0 | 0 | 0 | 0 | 0 | ||||||
| Financial &other assets | 5,815 | 8,930 | 8,091 | 8,091 | 8,091 | ||||||
| Total assets | 35,865 | 35,037 | 36,850 | 39,112 | 41,684 | ||||||
| Accounts payable | 2,263 | 2,103 | 2,593 | 2,881 | 3,200 | ||||||
| Short-term debt | 1,804 | 547 | 239 | 239 | 239 | ||||||
| Long-term debt | 0 | 0 | 0 | 0 | 0 | ||||||
| Provisions &other liab | 2,876 | 2,749 | 6,609 | 6,609 | 6,609 | ||||||
| 6,943 | 5,400 | 9,441 | 10,048 | ||||||||
| Total liabilities | 9,729 | 31,636 | |||||||||
| Shareholders' equity Minority interests | 28,922 0 | 29,637 0 | 27,410 0 | 29,383 0 | 0 | ||||||
| Total equity | 28,922 | 29,637 | 27,410 | 29,383 | 31,636 | ||||||
| Net debt (Adj) | -1,814 | -2,862 | -3,863 | -4,313 | -5,054 | ||||||
| Net debt to equity (Adj) (%) | -6.3 | ||||||||||
| For definitions of the items in this | please click here. | -9.7 | -14.1 | -14.7 | -16.0 |
Prepared for Kevin Lu
Earnings estimate revision and TP -We slightly trim our earnings estimates 2-3% for 2026-28 mainly to factor in 2Q26 GPM miss. We keep our target price unchanged at NT$460 based on 2H26-1H27E 17x P/E. We reiterate our Buy on Eclat as we see fundamentals improving marginally h/h, with input cost pressure starting to ease and order visibility remaining healthy at 6 months. Meanwhile, valuation looks increasingly attractive - the stock is trading at 11.5x our NTM EPS, new the low end of its historical range of 11-34x. With fundamentals turning more favorable, we see limited downside from current levels. In addition, a 6% dividend yield provides further downside support while investors wait for earnings momentum to strengthen.
Figure 1. Eclat: Earnings Estimates Revision
| 2026E | 2026E | 2026E | 2027E | 2027E | 2027E | 2028E | 2028E | 2028E | |
|---|---|---|---|---|---|---|---|---|---|
| NT$ mn | New | Old | Chg | New | Old | Chg | New | Old | Chg |
| Revenue | 41,441 | 41,369 | 0% | 46,322 | 46,405 | 0% | 51,785 | 52,073 | -1% |
| Gross profit | 12,877 | 12,944 | -1% | 14,713 | 14,842 | -1% | 16,804 | 17,017 | -1% |
| Operatingprofit | 8,665 | 8,871 | -2% | 10,016 | 10,283 | -3% | 11,566 | 11,912 | -3% |
| Pre-tax profit | 8,934 | 9,112 | -2% | 10,031 | 10,298 | -3% | 11,586 | 11,922 | -3% |
| Net profit | 7,009 | 7,147 | -2% | 7,778 | 7,985 | -3% | 8,876 | 9,138 | -3% |
| Basic EPS(NT$) | 25.55 | 26.05 | -2% | 28.35 | 29.10 | -3% | 32.35 | 33.31 | -3% |
| Ratio | |||||||||
| Gross margin (%) | 31.1 | 31.3 | -0.2 | 31.8 | 32.0 | -0.2 | 32.4 | 32.7 | -0.2 |
| OPEXto Sales ratio (%) | (10.2) | (9.8) | -0.3 | (10.1) | (9.8) | -0.3 | (10.1) | (9.8) | -0.3 |
| Operatingmargin (%) | 20.9 | 21.4 | -0.5 | 21.6 | 22.2 | -0.5 | 22.3 | 22.9 | -0.5 |
| Net margin (%) | 16.9 | 17.3 | -0.4 | 16.8 | 17.2 | -0.4 | 17.1 | 17.5 | -0.4 |
© 2026 Citigroup Inc. No redistribution without Citigroup's written permission.
Source: Citi Research Estimates
NT$
522
435
348
261
Aug 25
• 2H26-1H27E Target P/E of 23x
4 67% Upside
NT$ 460.00
a 48% Upside
Bull/Bear: Eclat (1476.TW)
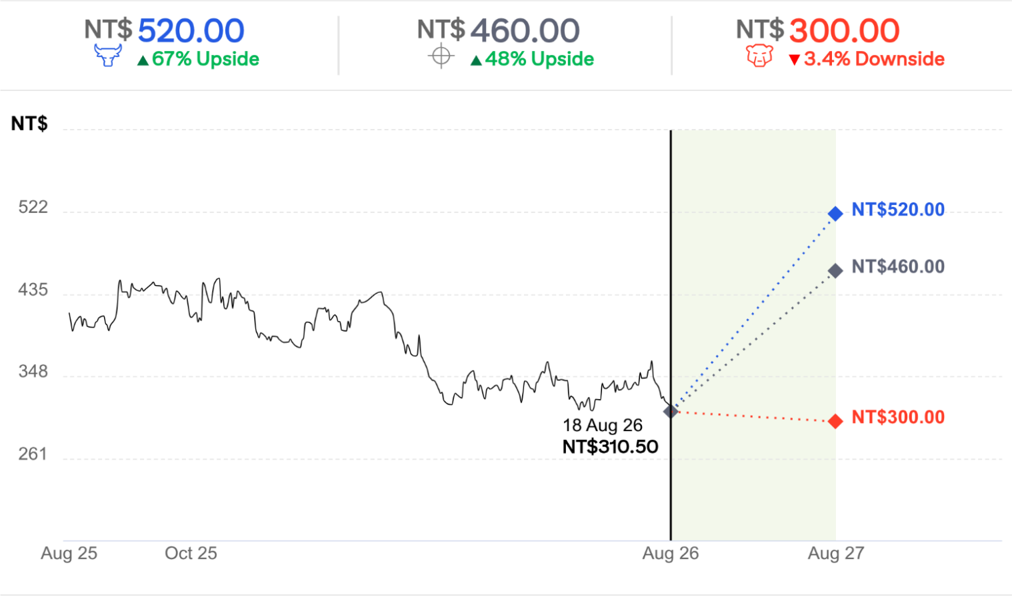
BASE Assumptions
Sales growth of 5-10% YoY in 2026E
- Gross margin at 31-31.5% in 2026E
• 2H26-1H27E Target P/E of 17x
BEAR Assumptions
- 423 ° Sales growth 0-5% YoY in 2026E · Gross margin at 29.5-30% in 2026E
• 2H26-1H27E Target P/E of 14x
Prepared for Kevin Lu
NT$ 300.00
· 3.4% Downside
Prepared for Kevin Lu
Eclat
Company description
Founded in 1977, Eclat is a niche apparel ODM/OEM with a unique vertical integration model. Eclat specializes in high-end functional fabrics and garments for active wear brands. Its largest brand customers include Nike, Target, lululemon, and UA. In 2024, Eclat's garment capacity was ~80% in Vietnam and ~20% in Cambodia. It is currently ramping up new facilities in Indonesia.
Investment strategy
We have a Buy rating on Eclat. We like Eclat's strong R&D capability in fabrics and product innovations, which should give Eclat stronger bargaining power when negotiating tariffs with customers, supporting a steady sales/earnings trend vs. other suppliers. We expect ongoing strong order strength from emerging brands, along with new customer acquisition, to drive sales growth of 9% y/y in 2026E, while product mix upgrade, positive FX, and rising efficiency should boost solid margin expansion, driving a record EPS in 2026E. We view current risk/reward as attractive and expect a margin recovery to serve as a positive catalyst.
Valuation
Our target price for Eclat of NT$460 is based on 17x 2H26H-1H27E EPS, 15% below its historical average in view of persisting uncertainties on consumption trend and oil price fluctuations.
Risks
Key downside risks that could prevent the shares from reaching our target price include: rising tariff tensions, conservative consumer spending, slower capacity ramp-up in Indonesia, softer order outlooks by brand customers, and a lukewarm macro environment.
If you are visually impaired and would like to speak to a Citi representative regarding the details of the graphics in this document, please call USA 1-888-500-5008 (TTY: 711), from outside the US +1-210-677-3788