PDF 原檔:260620_全球智慧型手機_gs_global-smartphones_original.pdf
原始內容
Global Smartphones: Shipments at -10%/ +3%/ +1% YoY in 2026-28E: High memory costs weigh on demand; product mix upgrade continues
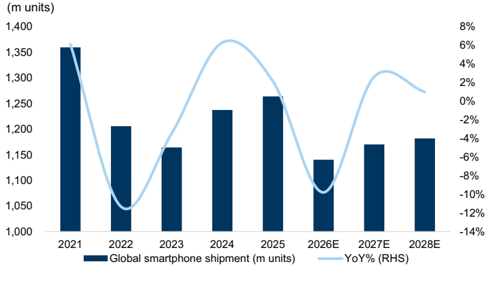
We cut our smartphone TAM for 2026E / 27E to re fl ect our global technology analysts' latest estimate changes, with high memory prices continuing to weigh on end-demand, while product mix upgrade continues as end users are less sensitive to price increases. We reduce our global smartphone volume estimates by 4% / 3% to 1.1bn / 1.2bn in 2026E / 27E, or -10% / +3% YoY (vs. -6% / +2% previously).
We also introduce 2028E estimates. We remain positive on the rising penetration of foldable phones ahead, driven by global leading brands newly entering the market in 2H26, along with new form factors and features bringing new use cases and enhancing the user experience. We model global foldable phone penetration to reach 3.6% / 5.9%/ 6.8% in 2026 / 27E/ 28E in our last update), or 41m / 69m/ 80m units in 2026 / 27/ 28E (-10% / -7% compared to our last update for 2026E / 27E).
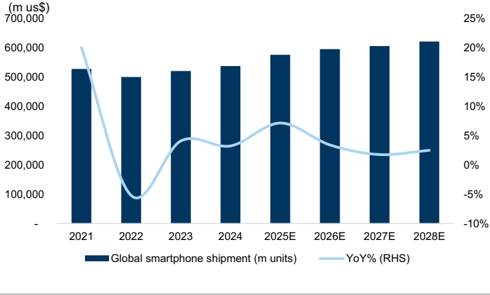
We expect smartphone market value to grow +3% / +2%/ +2% YoY to US$596bn/ 606bn/ 621bn in 2026-28E driven by higher memory cost and mix upgrade towards premium phones carrying higher prices at US$600+. We expect market premiumization to continue.
Related reports:
Global Tech: PCs, smartphones, servers: Quantifying market opportunities (Launching Global TAMs on Oct 3, 2023)
China Smartphones: AI phones with more speci fi c answers, smarter AI assistants, and interaction with apps for maps, delivery, social media (Updates on Nov 19, 2023)
Global Smartphones: Foldable: Introducing foldable phone forecasts; hinges and e-paper initiations (Updates on Feb 1, 2024)
Taiwan Technology: Foldable, AI server and satellite early-stage product cycles initiate SZS, Chenbro, WNC at Buy (August 22, 2024)
Global Tech: Smartphone TAM update: Introducing detailed breakdown by price band (Dec 7, 2024)
Global Tech: Smartphone TAM update: Foldable phones / Premium models better placed; overall market remains in modest growth (Jul 2, 2025)
Global Smartphones: Value TAM raised by 1% / 2% in 2026 / 27E on higher ASP; Foldable iPhones newly included (Oct 13, 2025)
Allen Chang
+852-2978-2930 | allen.k.chang@gs.com Goldman Sachs (Asia) L.L.C.
Verena Jeng
+852-2978-1681 | verena.jeng@gs.com Goldman Sachs (Asia) L.L.C.
Michael Ng, CFA
+1(212)902-8618 | michael.ng@gs.com Goldman Sachs & Co. LLC
Giuni Lee
+82(2)3788-1177 | giuni.lee@gs.com Goldman Sachs (Asia) L.L.C., Seoul Branch
Timothy Zhao
+852-2978-2673 | timothy.zhao@gs.com Goldman Sachs (Asia) L.L.C.
James Schneider, Ph.D.
+1(212)357-2929 | jim.schneider@gs.com Goldman Sachs & Co. LLC
Daiki Takayama
+81(3)4587-9870 | daiki.takayama@gs.com Goldman Sachs Japan Co., Ltd.
Minami Munakata
+81(3)4587-9830 | minami.munakata@gs.com Goldman Sachs Japan Co., Ltd.
Chao Wang
+886(2)2730-4195 | kuanchao.wang@gs.com Goldman Sachs (Asia) L.L.C., Taipei Branch
Evelyn Yu
+886(2)2730-4187 | evelyn.yu@gs.com Goldman Sachs (Asia) L.L.C., Taipei Branch
Ting Song
+852-2978-6466 | ting.song@gs.com Goldman Sachs (Asia) L.L.C.
Katherine Murphy
+1(212)902-1151 | katherine.a.murphy@gs.com Goldman Sachs & Co. LLC
Zorayda Montemayor
+1(212)357-6403 | zorayda.montemayor@gs.com Goldman Sachs & Co. LLC
Taeyong Lee
+82(2)3788-0981 | taeyong.lee@gs.com Goldman Sachs (Asia) L.L.C., Seoul Branch
Goldman Sachs does and seeks to do business with companies covered in its research reports. As a result, investors should be aware that the fi rm may have a con fl ict of interest that could a ff ect the objectivity of this report. Investors should consider this report as only a single factor in making their investment decision. For Reg AC certi fi cation and other important disclosures, see the Disclosure Appendix, or go to www.gs.com/research/hedge.html. Analysts employed by non-US a ffi liates are not registered/quali fi analysts with FINRA in the U.S.
ed as research e92c7a75ab8b4efbba794e6b187208c8
Global Smartphones: Cutting TAM growth to -6% / +2% on memory tightness (Jan 25, 2026)
Global smartphone market outlook
2026E / 27E/ 28E shipment forecast at -10% / +3%/ +1% YoY
We update our Global Smartphone forecasts as we factor in the latest estimates for Transsion, Apple, Samsung, Xiaomi, Lenovo, HTC and Asus. We remain cautious on smartphone market demand, expecting volume to fall 10% YoY to 1.14bn units in 2026E, considering the saturated market and rising memory costs that will depress consumer purchases. We expect the global smartphone value TAM to sustain growth at 3% YoY to US$596bn in 2026E, supported by the higher memory cost and mix upgrades towards premium smartphones carrying higher ASP at over US$600. We continue to expect foldable phones to see stronger traction given form factor changes bringing larger screens and di ff erentiation, new use cases, and more a ff ordable prices.
Exhibit 1: We expect global smartphone volumes at -10% / +3%/ +1% YoY to 1.14bn / 1.17bn/ 1.18bn units in 2026E / 27E/ 28E
Source: Company data, Goldman Sachs Global Investment Research, IDC
Exhibit 2: We expect global smartphone value to increase +3% / +2%/ +2% YoY to US$596bn / US$606bn/ US$621bn in 2026E / 27E/ 28E
Source: Company data, Goldman Sachs Global Investment Research
Compared to our last update, we reduce our global smartphone shipment estimates by -4% / -3% to 1.14bn / 1.17bn in 2026-27E, and introduce our 2028 estimates at 1.18bn. We adjust our value estimates by 2% / -1% to US$596bn/ 606bn on the back of product mix upgrades and higher memory cost, and introduce our 2028E estimate at $621 bn.
e92c7a75ab8b4efbba794e6b187208c8
Exhibit 3: Global smartphone estimate changes
| Global smartphone shipment | 2026E | 2027E | 2028E |
|---|---|---|---|
| New | |||
| Global smartphone shipment (m units) | 1,140 | 1,170 | 1,182 |
| YoY | -10% | 3% | 1% |
| Old | |||
| Global smartphone shipment (m units) | 1,187 | 1,212 | |
| YoY | -6% | 2% | |
| New vs. Old | |||
| Shipment change (m units) | (47) | (41) | |
| Shipment change% | -4.0% | -3.4% | |
| Global smartphone revenues | 2026E | 2027E | 2028E |
| New | |||
| Global smartphone revenues (m US$) | 595,740 | 606,273 | 621,389 |
| YoY | 3% | 2% | 2% |
| Old | |||
| Global smartphone revenues (m US$) | 581,307 | 614,526 | |
| YoY | 3% | 4% | |
| New vs. Old | |||
| Revenue change (m UT$) | 14,433 | (8,253) | |
| Revenue change% | 2% | -1% | |
| Global foldable shipment | 2026E | 2027E | 2028E |
| New | |||
| Penetration | 3.6% | 5.9% | 6.8% |
| Old | |||
| Penetration | 3.4% | 4.1% | |
| New vs. Old | |||
| Shipment change (m units) | (4) | (5) | |
| Shipment change% | -10% | -7% | |
| Penetration | 0.1ppts | 1.8ppts |
Source: IDC, Goldman Sachs Global Investment Research
Foldable phones
We are positive on the increasing penetration of foldable phones, supported by new model launches, improving supply chains to support more a ff ordable prices, and innovative designs (e.g. tri-fold phones, thinner battery, lighter casings). We revise our foldable phone volume estimates by -10%/ -7% in 2026/ 27E, bringing our global foldable phones shipments to 41m/ 69m units in 2026-27E, or penetration rates at 3.6%/ 5.9% in 2026E-27E (vs. 3.4%/ 4.1% previously), and introduce 2028E foldable phone estimates at 80m units.
Global smartphone market by price band
We categorize the global smartphone market into three segments based on pricing: Premium phones (Selling price > US$600), Mid-end (US$200-600) and Entry level (<US$200).
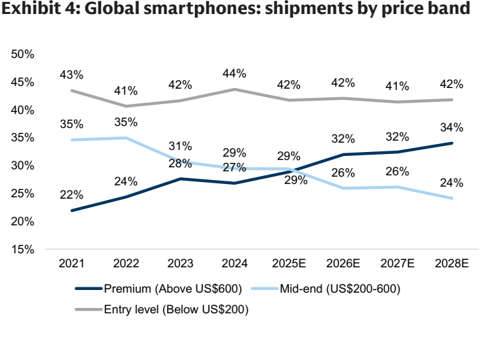
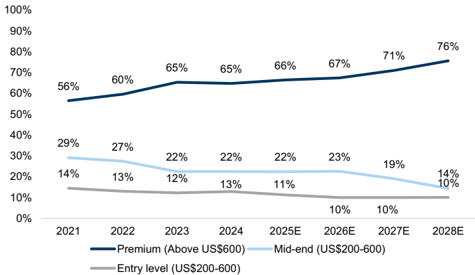
Premium (>US$600) smartphone market volume looks set to outgrow the market average. The purchasing power of premium consumers remains strong despite the dynamic macro environment and increasing memory prices, and continuous technology upgrades in premium models create additional demand. We expect premium smartphone market volume to grow at a 5% CAGR in 2026-28E to 402m units in 2028E , accounting for 34% of total volume by 2028 (vs. 29% in 2025). By value, we expect the premium segment to contribute 76% of total revenues by 2028E (vs. 66% in e92c7a75ab8b4efbba794e6b187208c8
2025), growing at an 8% CAGR.
The mid-end (US$200-600) smartphone market is shrinking due to changes in consumer behavior. While the mid-end segment used to provide a balance between outstanding speci fi cations and a high performance-cost ratio, demand has been declining due to a lack of revolutionary technology upgrades and more conservative consumption behavior among the middle class. We expect mid-end smartphone market volume to decline at a -2% CAGR to 285m units in 2026-28E, contributing 24% of the total market in 2028E (vs. 29% in 2025). By value, we expect the mid-end segment to contribute 14% of total revenues by 2028E (vs. 22% in 2025).
Entry level (<US$200) smartphone demand is likely to sustain, supported by the ongoing 4G to 5G migration in developing markets, as well as consumption downgrading amid macro challenges. However, increasing memory prices will a ff ect the entry level segment most, in our view, considering that purchasers are price sensitive. We expect entry level smartphone market volume to grow at a 1% CAGR to 494m units in 2026-28E , accounting for 42% of the total market in 2028E (v.s. 42% in 2025). By value, we forecast the entry level segment will contribute 10% of total revenues by 2028E (vs. 11% in 2025).
Source: Company data, Goldman Sachs Global Investment Research, IDC
Exhibit 5: Global smartphones: value by price band
Source: Company data, Goldman Sachs Global Investment Research
e92c7a75ab8b4efbba794e6b187208c8
Exhibit 6: Smartphone models pipeline (announced)
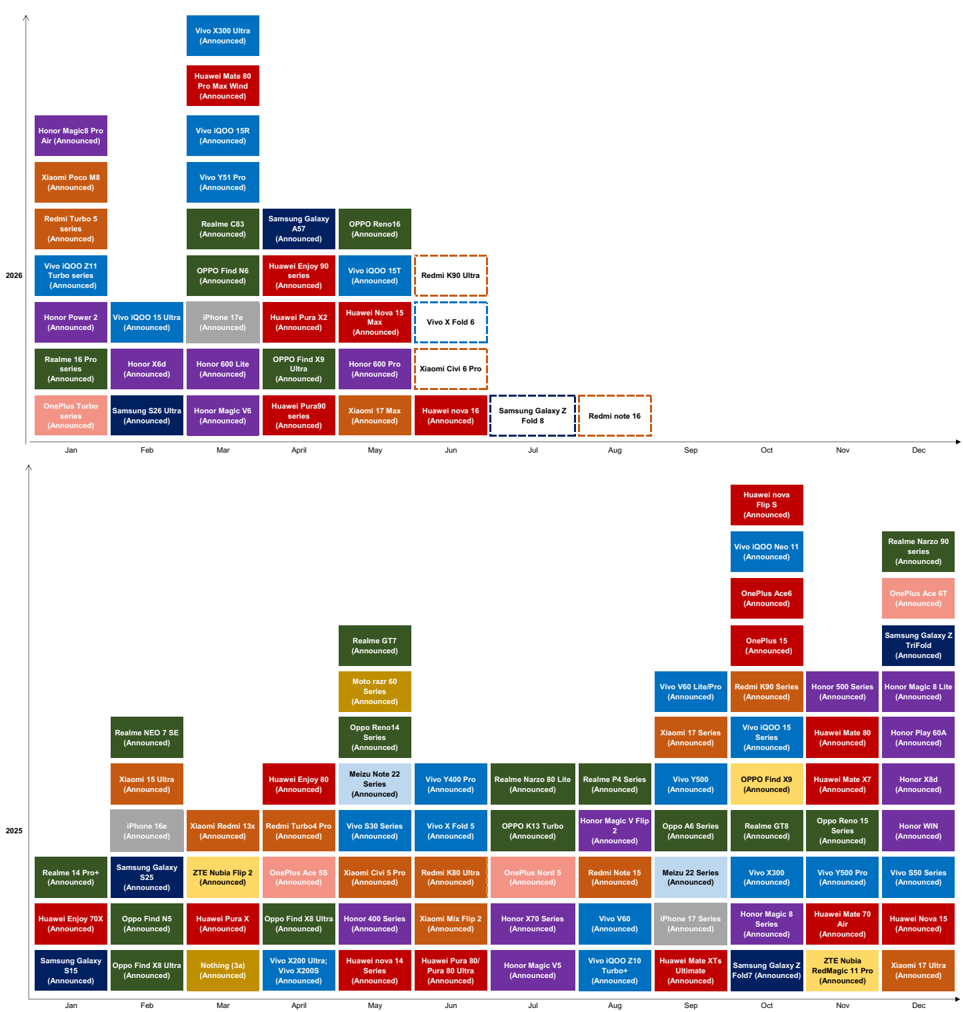
As of Jun 14, 2026.
Source: Company data
e92c7a75ab8b4efbba794e6b187208c8
Smartphones: Shipments -10% / +3%/ +1% YoY in 2026-28E; Foldable phones at 41m / 69m/ 80m units in 2026-28E
Global Smartphone market opportunity
| (Shipments in munits) | Shipments by vendor | 1Q25 | 2Q25 | 3Q25 | 4Q25 | 1Q26 | 2Q26E | 3Q26E | 4Q26E | 2023 | 2024 | 2025 | 2026E | 2027E | 2028E | 2028E | 2028E | 2028E | 2028E | 2028E |
|---|---|---|---|---|---|---|---|---|---|---|---|---|---|---|---|---|---|---|---|---|
| (Revenues in mUSD) | Global shipments | 303 | 297 | 326 | 338 | 294 | 269 | 284 | 293 76 | 1,164 | 1,237 233 | 1,264 | 1,140 | 1,170 257 | 1,182 262 | 1,182 262 | 1,182 262 | 1,182 262 | 1,182 262 | 1,182 262 |
| Apple Samsung | 59 61 | 48 58 | 60 61 | 85 61 | 61 62 | 53 59 | 57 59 | 55 | 234 226 | 224 | 252 242 | 246 235 | 233 | 240 | 240 | 240 | 240 | 240 | 240 | |
| Our Bottom up method | Xiaomi Transsion | 42 21 | 39 25 | 39 29 | 35 23 | 34 21 | 34 19 | 34 22 | 33 17 | 146 168 95 | 107 | 155 98 59 | 78 50 | 97 48 | 102 48 | 102 48 | 102 48 | 102 48 | 102 48 | 102 48 |
| Global smartphone | Lenovo ZTE | 13 2 | 14 2 | 16 2 | 16 2 | 14 2 | 11 2 | 12 2 | 13 2 | 47 6 | 56 7 | 9 | 9 | 9 | 9 | 9 | 9 | 9 | 9 | 9 |
| Sony | 0 | 0 | 0 | 0 | 0 | 0 | 0 | 0 | 2 | 1 | 1 | 1 | 1 | 1 | 1 | 1 | 1 | 1 | 1 | |
| shipments = sum of shipment by brand | HTC | 0.0 | 0.0 | 0.0 | 0.0 | 0.0 | 0.0 0.1 | 0.0 0.1 | 0.0 0.1 | 0 0 | 0 | 0 0 | 0 0 | 0 0 | 0 | 0 | 0 | 0 | 0 | 0 |
| Asus Others | 0.1 104 | 0.0 110 | 0.0 119 | 0.0 115 | 0.1 99 | 91 | 99 | 96 | 409 | 0 440 | 448 | 385 | 388 | 0 380 | 0 380 | 0 380 | 0 380 | 0 380 | 0 380 | |
| Global smartphone | Shipments YoY | 1Q25 | 2Q25 | 3Q25 | 4Q25 | 1Q26 | 2Q26E | 3Q26E | 4Q26E | 2023 | 2024 | 2025 | 2026E | 2027E | 2028E | 2028E | 2028E | 2028E | 2028E | 2028E |
| revenues = sum of revenues | Global | 1% | 2% | 4% | 3% | -3% | -9% 9% | -13% -5% | -13% -11% | -3% 4% | 6% | 2% | -10% -2% | 3% 5% | 1% 2% | 1% 2% | 1% 2% | 1% 2% | 1% 2% | 1% 2% |
| by brand | Apple Samsung | 12% 2% | 6% 7% | 4% 7% | 9% 18% | 3% 2% | 1% -13% | -4% -13% | -10% -5% | -14% | -1% -1% | 8% 8% | -3% | -1% 0% | 3% | 3% | 3% | 3% | 3% | 3% |
| Global smartphone | Xiaomi Transsion | 3% -26% | -8% -2% | -8% 13% | -18% -16% | -19% -1% | -25% | -25% | -25% | -5% 31% | 16% 13% | -8% -8% | -13% -20% | 24% | 3% 5% | 3% 5% | 3% 5% | 3% 5% | 3% 5% | 3% 5% |
| revenues = shipments x ASP | Lenovo | 2% | 2% | 5% | 12% | 6% | -21% | -23% | -21% -1% | 4% 3% | 20% 28% | 5% 27% | -15% | -4% | 0% | 0% | 0% | 0% | 0% | 0% |
| ZTE Sony | 46% | 51% | 14% | 8% -15% | -1% -21% | -1% -21% | -1% -21% | -21% | -38% | -32% | -21% | -1% | -1% -5% | -1% | -1% | -38% | -1% | -1% | -1% | |
| HTC | -42% 69% | -22% -6% | -66% -50% | -44% | -62% | 42% | 141% | 128% | 27% | -45% | -13% -48% | 33% | 7% 1% | 0% -5% | 0% -5% | 0% -5% | 0% -5% | 0% -5% | 0% -5% | |
| Smartphone shipments by | Asus | -30% | -45% | -51% | -75% | -36% | 9% | 116% | 199% | -33% | -18% | 26% | 0% | 0% | 0% | 0% | 0% | 0% | ||
| brands (2024) | Others | 0% | -17% | -16% | -7% | 8% | 2% | |||||||||||||
| Shipments market share | 1Q25 | 1% 2Q25 | 4% 3Q25 | 2% 4Q25 | -4% 1Q26 | -17% 2Q26E | 3Q26E | 4Q26E | 2023 | 2024 | 2025 | -14% 2026E | 1% | -2% 2028E | 2027E | -2% 2028E | -2% 2028E | -2% 2028E | -2% 2028E | |
| Apple Others 35% | Apple | 20% 20% | 16% | 18% 19% | 25% | 21% | 20% | 20% | 26% | 20% | 19% | 20% 19% | 22% | 22% | 22% 20% | 22% 20% | 22% 20% | 22% 20% | 22% 20% | 22% 20% |
| 19% | Samsung Transsion | 14% 7% | 20% 13% | 12% | 18% | 21% | 22% | 21% | 19% | 19% 13% | 18% | 21% | 20% | |||||||
| Xiaomi | 4% | 8% | 9% 5% | 10% 7% | 12% | 13% 7% | 12% | 11% 6% | 8% | 14% 9% | 12% 8% | 12% | 12% | 12% 9% | 12% 9% | 12% 9% | 12% 9% | 12% 9% | 12% 9% | |
| Samsung | Lenovo | 5% | 7% | 8% | 4% | 4% | 5% | 5% | 7% | 8% | 4% | 4% | 4% | 4% | 4% | 4% | ||||
| 18% | ZTE | 1% | 5% | 1% | 1% | 5% 1% | 4% 1% | 4% | 1% | 0% | 1% | 4% | 4% 1% | 1% | 1% | 1% | 1% | 1% | 1% | |
| Transsion Lenovo | Sony | 0% | 1% 0% | 0% 0% | 0% 0% | 0% 0% | 0% 0% | 1% 0% | 0% | 0% | 0% | 1% 0% | 1% 0% | 0% | 0% | 0% | 0% | 0% | 0% | 0% |
| Xiaomi 14% 9% 4% | HTC Asus | 0% 0% | 0% 0% | 0% | 0% | 0% | 0% | 0% 0% | 0% 0% | 0% 0% | 0% 0% | 0% | 0% 0% | 0% 0% | 0% 0% | 0% 0% | 0% 0% | 0% 0% | 0% 0% | 0% 0% |
| Developed markets YoY | Others Shipments by price band Premium (Above US$600) | 34% 1Q25 | 37% 2Q25 | 36% 3Q25 | 34% 4Q25 | 34% 1Q26 | 34% 2Q26E | 35% 3Q26E | 33% 4Q26E | 35% 2023 | 36% 2024 | 0% 35% 2025 | 34% 2026E | 33% 2027E | 32% 2028E | 32% 2028E | 32% 2028E | 32% 2028E | 32% 2028E | 32% 2028E |
| -1% -4% 1% | Mid-end (US$200-600) Entry level (Below US$200) | 29% 30% 42% | 24% 33% 44% | 28% 29% 43% 3Q25 | 34% 27% 39% | 30% 31% 39% | 26% 30% | 32% 23% 45% | 40% 19% 41% | 28% 31% 42% | 27% 29% 44% | 29% 29% 42% | 32% 26% 42% | 32% 26% 41% | 34% 24% 42% | 34% 24% 42% | 34% 24% 42% | 34% 24% 42% | 34% 24% 42% | 34% 24% 42% |
| -2% | Revenus by vendor Global revenues | 1Q25 135,893 | 2Q25 121,581 | 143,664 61,539 | 4Q25 174,953 98,704 | 1Q26 152,364 | 44% 2Q26E 130,682 | 3Q26E 145,390 69,001 | 4Q26E 167,304 97,452 22,080 | 2023 2024 520,767 244,908 | 537,641 245,107 97,604 | 576,091 595,740 269,403 105,705 | 296,379 | 606,273 303,875 104,557 | 621,389 309,704 109,984 | 621,389 309,704 109,984 | 621,389 309,704 109,984 | 621,389 309,704 109,984 | 621,389 309,704 109,984 | 621,389 309,704 109,984 |
| -7% 2023 2024 2025 2026E 2027E | Apple Samsung Xiaomi | 59,982 28,658 9,399 | 49,179 24,514 8,730 | 29,064 9,413 | 23,470 9,080 | 69,310 31,309 8,545 | 60,617 26,328 9,285 | 28,039 10,172 | 9,760 | 102,181 32,183 | 107,757 37,763 10,546 | 38,951 13,757 | 41,422 | 41,422 | 41,422 | 41,422 | 41,422 | 41,422 | ||
| US YoY | Transsion | 2,424 | 2,946 | 3,417 | 2,629 | 2,848 | 2,712 | 2,816 | 2,170 | 11,493 | 36,477 12,615 | 36,622 11,415 14,574 | 13,307 | 15,403 | 15,403 | 15,403 | 15,403 | 15,403 | 15,403 | |
| 0% | Lenovo | 3,187 | 3,469 | 3,725 | 3,108 | 3,318 341 | 11,608 | 13,661 | 14,433 | 14,433 | 14,433 | 14,433 | 14,433 | 14,433 | ||||||
| 0% | ZTE | 358 | 377 | 4,193 | 3,916 313 | 3,088 400 | 107 | 1,089 | 13,430 | 1,387 502 | 1,367 | 1,367 | 1,367 | 1,367 | 1,367 | 1,367 | ||||
| -2% | Sony HTC | 116 4 | 265 4 | 410 107 | 349 128 | 97 | 367 221 | 89 5 | 5 | 1,219 | 1,110 893 | 1,494 617 | 1,422 513 | 17 | 517 | 517 | 517 | 517 | 517 | 517 |
| 2 | 2 | 1 | 6 42 | 42 | 51 | 13 | 17 | 16 | 16 | 16 | 16 | 16 | 16 | |||||||
| -5% | Asus | 69 | 40 | 18 | 16 | |||||||||||||||
| -7% | Others | 20 | 42 | 27 317 | 283 | 148 136,101 2025 | 176 | 170 | 161 128,381 2028E | 161 128,381 2028E | 161 128,381 2028E | 161 128,381 2028E | 161 128,381 2028E | 161 128,381 2028E | ||||||
| 2023 2024 2025 2026E 2027E | Revenues by price band Premium (Above US$600) | 31,696 1Q25 67% | 32,058 2Q25 60% 27% | 35,967 3Q25 66% 22% | 36,379 4Q25 71% 20% | 35,983 1Q26 63% 28% | 27,996 2Q26E 59% 30% | 31,737 3Q26E 69% 21% | 32,020 4Q26E 78% 14% | 115,741 2023 65% 22% | 129,876 2024 65% 22% | 66% 22% 11% | 127,737 2026E 67% 23% | 129,749 2027E 71% 19% | 76% 14% 10% 2028E | 76% 14% 10% 2028E | 76% 14% 10% 2028E | 76% 14% 10% 2028E | 76% 14% 10% 2028E | 76% 14% 10% 2028E |
| China YoY 6% 0% 0% - | Mid-end (US$200-600) Entry level (Below US$200) Shipments by region Global shipments Developed markets | 21% 12% 1Q25 | 13% 2Q25 297 | 12% 3Q25 326 | 9% 4Q25 338 | 10% 1Q26 294 | 11% 2Q26E 269 | 11% 3Q26E 284 | 9% 4Q26E 293 78 | 12% 2023 1,164 | 13% 2024 1,237 270 | 2025 1,264 268 | 10% 2026E 1,140 | 10% 2027E 1,170 257 122 | 1,182 259 | 1,182 259 | 1,182 259 | 1,182 259 | 1,182 259 | 1,182 259 |
| -5% 0% | USA | 303 62 | 56 | 67 | 82 | 60 | 54 | 64 31 | 39 | 276 131 | 128 | 128 | 256 122 | 122 | 122 | 122 | 122 | 122 | 122 | |
| -10% | Western Europe | 30 24 | 25 23 | 33 24 135 | 41 29 135 | 28 23 115 | 23 22 107 | 28 121 | 106 479 | 102 512 | 96 462 | 97 | 98 472 | 98 472 | 98 472 | 98 472 | 98 472 | 98 472 | ||
| BRICs India | 124 33 | 125 | 48 | 32 | 23 119 41 | 35 | 146 | 151 | 100 518 156 | 136 | 470 142 | 142 | 142 | 142 | 142 | 142 | 142 | |||
| China markets | 72 | 38 69 | 68 | 38 76 | 28 69 | 59 | 62 | 66 | 271 | 286 | 285 | 257 | 258 | 258 | 258 | 258 | 258 | 258 | ||
| BRICs YoY | Rest of emerging Shipments YoY Global | 116 1Q25 | 117 2Q25 | 124 3Q25 | 121 4Q25 | 120 1Q26 | 109 2Q26E -9% | 101 3Q26E -13% | 93 4Q26E -13% | 409 2023 -3% | 456 2024 6% | 478 2025 2% | 256 422 2026E | 443 2027E 3% | 451 2028E 1% | 451 2028E 1% | 451 2028E 1% | 451 2028E 1% | 451 2028E 1% | 451 2028E 1% |
| 7% 1% | Developed markets USA | 1% | 2% -2% | 4% 1% 2% | 3% 1% 2% | -3% -4% -5% | -4% -5% | -4% -5% | -5% -5% | -7% -7% | -2% -2% | -1% 0% | -10% -4% -5% | 1% 0% | 1% 0% | 1% 0% | 1% 0% | 1% 0% | 1% 0% | |
| -4% 2% | Western Europe BRICs | -4% -3% -5% | -1% -3% | -1% | -1% | -4% | -4% -14% | -4% -12% | -4% -10% | -6% | -3% | -2% | -4% | 1% 0% 1% 2% | 1% 0% | 1% 0% | 1% 0% | 1% 0% | 1% 0% | 1% 0% |
| -11% | India | 0% -5% | 1% 8% | 3% | 1% 3% | -7% -15% | -15% -10% | -8% -13% | -4% | 7% 4% | 1% 3% 0% | |||||||||
| 2023 2024 2025 2026E | China Rest of emerging | 3% | -4% | 6% 0% | -1% | -4% | -15% -14% | -23% | 1% -5% 0% | 6% | -11% -13% -10% -12% | 4% 0% 5% | 0% | 0% | 0% | 0% | 0% | 0% | ||
| 2027E | Shipments market share | 3% | 4% | 6% | 6% | 3% | -7% | -19% | 4Q26E | 11% | 5% | |||||||||
| markets Global | 1Q25 | 2Q25 | 3Q25 | 4Q25 | 1Q26 | 2Q26E | 3Q26E | 2023 | 2024 | 2025 100% | 2026E | 2027E | 0% 2% 2028E | 0% 2% 2028E | 0% 2% 2028E | 0% 2% 2028E | 0% 2% 2028E | 0% 2% 2028E | ||
| Rest of emerging mkt YoY | Developed markets USA | 100% 21% | 100% 19% | 100% 21% 10% | 100% 24% 12% | 100% 20% 10% | 100% 20% 9% | 100% 23% 11% | 100% 27% 13% | 100% 24% 11% | 100% 22% 10% | 21% 10% | 100% 22% 11% 8% | 100% 22% 10% 8% | 100% 22% 10% 8% | 100% 22% 10% 8% | 100% 22% 10% 8% | 100% 22% 10% 8% | ||
| Western Europe | 10% 8% | 8% | 7% | 9% | 8% | 8% | 9% | 9% | 8% | 8% | ||||||||||
| 11% 5% | BRICs | 41% | 8% 42% | 41% | 40% | 8% 39% | 42% | 41% | 41% | 41% | 40% | 40% | 40% | 40% | 40% | 40% | 40% | |||
| India China | 11% | 13% | 15% | 11% | 9% 23% | 40% 12% 22% | 14% 22% | 12% 23% | 12% 23% | 12% | 41% 12% 23% | |||||||||
| 0% 5% | Rest of | 24% | 23% | 21% 38% | 22% | 36% | 32% | 35% | 23% 37% | 38% | 41% 12% 22% 37% | 12% 22% | 12% 22% 38% | 12% 22% 38% | 12% 22% 38% | 12% 22% 38% | 12% 22% 38% | |||
| -12% 2023 2024 2025 2026E | emerging markets Foldable phones Shipment | 38% 1Q25 | 39% 2Q25 3.3 | 3Q25 8.0 | 36% 4Q25 4.7 | 41% 1Q26 3.8 | 40% 2Q26E 5.9 | 3Q26E 14.1 | 4Q26E 16.9 | 2023 18.2 | 2024 18.7 | 2025 20.2 | 2026E 40.6 3.6% 0.6 0.6 3.6 | 38% 2027E 69.1 5.9% | 2028E 80.4 | |||||
| Penetration rate | 4.2 1.4% | 2.4% | 1.4% | 1.3% | 2.2% | 5.8% | 1.6% 0.3 | 1.5% 0.8 | 6.8% 1.1 | 6.8% 1.1 | 6.8% 1.1 | 6.8% 1.1 | 6.8% 1.1 | 6.8% 1.1 | 6.8% 1.1 | |||||
| 2027E | Xiaomi Transsion | 0.1 0.0 | 1.1% 0.1 0.0 | 0.1 | 0.1 | 0.1 | 0.1 | 5.0% 0.2 | 0.1 0.2 | 1.6% 0.5 0.1 | 0.8 1.5 5.7 | 1.7 | 1.7 | 1.7 | 1.7 | |||||
| Lenovo Samsung | 0.8 0.5 | 0.6 | 0.0 | 0.0 | 0.0 0.5 | 0.2 1.2 | 0.2 1.0 | 0.1 0.2 | 8.3 34.4 | 10.3 10.0 | 10.3 10.0 | 10.3 10.0 | 10.3 10.0 | 10.3 10.0 | 10.3 10.0 | 10.3 10.0 | 10.3 10.0 | 10.3 10.0 | ||
| Apple Others | - | 0.4 - | 0.6 4.8 | 0.7 1.4 - | 0.8 - | 0.6 3.8 | 4.0 4.6 | 0.8 1.8 9.5 | 1.2 10.0 - | 2.7 6.4 - | 2.7 7.0 - | 7.2 14.1 14.7 | 37.2 20.0 | 37.2 20.0 | 37.2 20.0 | 37.2 20.0 | 37.2 20.0 | 37.2 20.0 | 37.2 20.0 | |
| 2.8 | 2.2 | - 2.5 | 2.5 | 2.3 | - | 4.0 | 4.5 | 6.5 | 8.7 | 10.0 | 10.0 | 10.0 | 10.0 | 18.4 | 10.0 | 10.0 | 10.0 | 10.0 |
Source: Company data, Goldman Sachs Global Investment Research
e92c7a75ab8b4efbba794e6b187208c8
PCs: -10% / +2%/ +3% YoY in 2026E-28E
Global PCs market opportunity
| (Shipments in munits) | Shipments by product | 1Q25 2Q25 3Q25 4Q25 1Q26E 2Q26E 3Q26E 4Q26E 2023 2024 2025 2026E 2027E 2028E | ||||||||||||||||
|---|---|---|---|---|---|---|---|---|---|---|---|---|---|---|---|---|---|---|
| Global PCs shipments (m units) | 64 268 | 69 | 76 | 76 62 | 59 | 68 | 69 19 | 260 | 264 | 285 | 257 261 69 | 67 | ||||||
| Desktops Notebooks | 18 67 45 194 | 18 49 | 20 | 53 | 21 16 54 44 | 15 42 | 19 47 | 48 | 72 181 | 70 186 | 76 200 | 181 | 187 | |||||
| Our Bottom up method | Workstations | 2 8 | 2 | 2 | 2 | 2 2 | 2 | 2 | 7 | 8 | 8 | 7 | 7 | |||||
| Global PCs shipments = | YoY | 6% 3% | 7% | 9% | 10% | -3% | -15% | -10% | -10% | -14% | 1% | 8% | -10% | 2% | ||||
| Desktops | 4% 0% | 7% | 14% | 13% | -8% | -15% | -9% | -9% | -16% | -4% | 10% | -10% -10% | -2% | |||||
| sum of shipments by brands | Notebooks | 7% 4% | 7% | 7% | 9% -1% | -15% | -11% | -11% | -13% | 3% 11% | 8% 2% | 3% 3% | ||||||
| Global PCs revenues = | Workstations | 13% 3% 100% | 5% | 4% 100% | -11% 100% | -6% 100% | -14% | -8% | -8% 100% | -9% 100% | 100% | 100% | -9% 100% 100% | |||||
| Desktops ASP x shipments + | Mix | 100% 25% | 100% | 27% | 100% | 100% 27% | 27% | 28% | 26% | 27% | 27% | 26% | ||||||
| Notebooks ASP x shipments + Workstations ASP x shipments | Desktops Notebooks 3% | 27% 70% 72% 3% 3% | 26% 71% | 71% | 27% 71% | 26% 71% 3% | 26% 71% 3% | 70% 3% | 70% | 70% 3% | 71% | 70% | 70% 3% | 71% 3% | 3% | |||
| Workstations Revenues by product | 1Q25 2028E | 3% 2Q25 | 3Q25 | 3% 4Q25 | 1Q26E | 2Q26E | 3Q26E | 3% 4Q26E | 2023 222,164 | 2024 237,235 | 2025 | 2026E | 3% 2027E | |||||
| Global PCs revenues (US$ m) Desktops | 58,452 55,852 | 63,666 12,827 | 71,813 14,491 | 73,313 14,338 | 58,976 11,836 | 58,984 11,829 | 70,222 14,422 | 71,663 14,270 | 49,894 | 49,329 | 267,244 53,992 | 259,846 52,358 | 272,663 286,173 52,749 | |||||
| PCs shipments by region (2025) | Notebooks | 12,335 42,070 17,816 | 46,638 | 52,877 4,445 | 54,983 3,992 | 43,179 3,962 | 43,239 3,916 | 51,356 4,444 | 53,402 3,991 | 157,767 | 172,151 | 196,568 | 191,176 | 202,721 212,504 17,193 | ||||
| Workstations YoY | 4,046 | 4,201 | 12% | -7% | -2% | 14,503 | 15,755 | 16,684 | 16,312 | 5% | ||||||||
| Asia/Pacific | 5% | 14% | 12% | 1% | -2% | -16% | 7% | 13% | -3% | |||||||||
| (ex. Japan) Rest of World | Shipments by vendor | 12% 2028E | 2Q25 | 3Q25 | 4Q25 | 1Q26E 62 | 2Q26E 59 | 3Q26E | 4Q26E | 2023 | 2024 | 2025 | 2026E | 2027E | ||||
| 15% 20% | Global PCs shipments (m units) Lenovo 15 | 1Q25 64 69 268 67 | 69 17 | 76 | 76 19 | 18 | 15 | 68 13 19 | 18 | 260 59 | 264 | 285 | 257 65 | 261 66 | 62 | 70 | ||
| China 15% Western Europe | HP Dell Apple 6 | 13 50 10 8 37 7 7 28 | 14 10 6 | 9 7 | 14 | 15 11 7 | 13 9 6 | 11 11 9 6 | 12 9 | 54 37 22 | 36 23 | 39 26 | 48 35 26 27 | 47 36 | 51 | 55 | ||
| Japan 7% USA 18% | ASUS | 4 19 7 | 5 | 6 2 | 5 2 | 4 4 2 2 | 5 2 | 4 2 | 17 8 | 18 8 1 | 20 8 | 17 7 | 18 | |||||
| 25% | Samsung Microsoft | 2 0 1 | 2 0 | 0 | 0 | 0 0 | 0 | 0 | 2 | 1 | 1 | 7 1 | ||||||
| LG | 0 1 | 0 | 0 | 0 | 0 0 | 0 | 0 | 1 | 1 1 | 1 | 1 | 1 | ||||||
| PCs shipments growth by | Xiaomi | 0 1 | 0 | 0 | 0 0 | 1 | 1 | 1 | ||||||||||
| region | Others | 14 58 | 14 | 18 | (0) 12 | 13 | 0 | (0) | 1 60 | 63 | 64 | 56 | 57 | |||||
| 6% 3% | 7% | 9% | 18 10% -3% | 15 | 16 | -14% | 1% | 8% | -10% | 2% 100% | ||||||||
| Asia/Pacific (ex. Japan) YoY | YoY market share 24% | 100% 100% 27% 25% | 100% 25% | 100% | 100% | 100% | -15% 100% | -10% 100% 23% 28% | -10% 100% | 100% 23% | 100% 23% | 100% 24% | 100% 25% 19% | 25% 18% 14% | ||||
| 7% | Global Lenovo | 20% 19% 15% 14% | 20% 14% | 12% | 26% 18% | 24% 24% 20% 21% | 19% 15% | 16% 12% | 18% 13% | 21% 14% | 19% 14% | 19% 14% | 14% 10% | 10% | ||||
| 2% 3% | HP Dell Apple | 9% 10% 7% | 9% | 9% 8% | 14% 15% 9% 10% | 11% 7% 7% | 10% | 10% | 8% | 9% 7% | 9% 7% 3% | 7% 3% | 7% | |||||
| -6% -10% | ASUS | 6% 3% 3% | 7% | 3% 0% | 6% 2% | 3% | 7% 3% | 6% 3% | 6% | 1% | 3% 1% | |||||||
| 2024 2025 2026E 2027E 2028E | Samsung Microsoft | 1% 1% | 3% 0% | 3% 1% | 0% | 1% | 3% 1% | 3% | 0% | |||||||||
| US YoY | LG | 0% | 0% | 0% | 0% 0% | 1% 1% 0% | 0% | 1% 0% | 0% | 0% 0% | ||||||||
| Xiaomi | 0% 0% 0% | 0% | 0% | 0% | 0% | 0% | 0% | |||||||||||
| 3% 3% 3% 3% | Others | 22% 21% | 0% | 0% | 0% 0% | 0% 23% | 0% 23% | 0% 24% | 0% 23% | 22% | 22% | |||||||
| ASP | 23% 24% 20% 22% 23% 1Q25 2Q25 3Q25 4Q25 1Q26E 2Q26E 3Q26E 4Q26E 2023 2024 2025 2026E 2028E 915 924 951 960 953 1,008 1,036 1,045 854 900 939 1,012 1,066 6% 7% 3% 2% 4% 9% 9% 9% -2% 5% 4% 8% | 2027E 1,044 | ||||||||||||||||
| Global PC ASP (US$) YoY | ||||||||||||||||||
| -11% | AI PCs AI PC shipment (m units) | 22% | ||||||||||||||||
| 3% 2% 1Q25 2Q25 3Q25 4Q25 1Q26E 2Q26E 3Q26E 4Q26E 2023 2024 2025 2026E 2027E 2028E | ||||||||||||||||||
| 2024 2025 2026E 2027E | 18 22 29 35 33 33 41 43 52 103 150 | |||||||||||||||||
| 187 219 | ||||||||||||||||||
| 23% 99% | ||||||||||||||||||
| 2028E | ||||||||||||||||||
| 81% 57% 61% 88% 53% 42% 17% 60% | 46% 24% | |||||||||||||||||
| YoY Penetration AI PC revenues (US$ m) | 28% 32% 38% 45% 54% 57% 62% 81% 20,341 25,573 30,226 38,071 33,506 37,576 44,611 48,030 61% 42% 45% 65% 47% 26% 17% 35% 40% 42% 52% 57% 64% | 48% | 59% 72% 163,724 205,718 43% 26% | 239,818 | 63,383 | 20% | 114,211 | 36% 80% | ||||||||||
| YoY Penetration Gaming PCs | 64% 67% 84% 1Q25 2Q25 3Q25 4Q25 1Q26E 2Q26E 7 7 8 8 6 6 | 63% 75% | 27% | 43% | ||||||||||||||
| China YoY 4% 2% | Gaming PC shipment (m units) | 8% 14% 12% 9% -6% -21% 10% 11% 11% 10% 10% 10% | ||||||||||||||||
| -3% | 3Q26E 4Q26E 2023 2024 2025 2026E 2027E 2028E 7 7 28 31 26 28 31 -15% -13% 11% -14% 8% 9% 11% 10% 10% 11% 10% 11% 12% 56,591 | |||||||||||||||||
| 3% | YoY | |||||||||||||||||
| -10% 2024 2025 2026E 2027E 2028E | Penetration Gaming PC revenues (US$ m) | 10,436 | 11,855 | 13,401 | 12,505 | 10,435 | 12,587 | 11,898 | 40,502 | 48,197 19% | 45,284 | 51,031 | ||||||
| YoY Penetration | 17% 11% 18% 20% | 24% 19% | 19% 19% | 17% | 10,364 0% | -13% -6% | -5% 17% | 18% | -6% | 13% 19% 2027E | ||||||||
| 1Q25 2028E | 2Q25 | 3Q25 | 17% | 18% 1Q26E | 18% 2Q26E | 4Q26E | 2023 | 2025 277 | 2026E 250 | 17% 2024 | ||||||||
| Western Europe YoY | Shipments by markets | 261 | 67 | 74 36 | 4Q25 74 35 | 60 57 | 18% 3Q26E 66 | 67 | 256 118 137 | 17% 111 | 254 | |||||||
| Global PCs shipments (m units) Consumer PCs | 62 27 117 | 29 38 | 38 | 24 39 37 | 26 31 | 31 35 | 31 36 | 253 118 | 127 150 | 138 -10% | 140 2% | |||||||
| 4% 10% 1% 1% | Commercial PCs YoY | 35 144 6% 3% 3% | 7% 9% | 9% | 10% -3% | -15% | -10% -12% | -10% -12% | 135 -14% | -12% | 114 3% | 1% 0% | 8% | |||||
| -7% | Consumer PCs Commercial PCs Mix | 4% 8% 3% 100% 100% 45% | 6% 100% 44% | 10% 100% | 8% 13% | 7% -12% 4% 100% | -12% -17% 100% 100% | -8% -8% 100% 100% 45% 46% | -13% 100% | 7% 9% 100% 46% 54% 2025 43 42 20 68 49 | -8% 1% 100% 100% 45% 55% 2026E | -15% 47% 53% | 2% 100% 46% 54% | |||||
| 2024 2025 2026E 2027E 2028E | Consumer PCs Commercial PCs Shipments by region | 43% 57% 55% 1Q25 2028E | 56% 2Q25 | 48% 52% 3Q25 13 | 47% 53% 4Q25 | 10 | 39% 61% 55% 1Q26E 2Q26E 9 | 47% 53% 54% 3Q26E 4Q26E 12 9 10 11 | 2023 42 | 2024 40 | 45% 55% 2027E 39 | 40 14 | ||||||
| Asia/Pacific (ex. Japan) China Japan | 9 40 9 40 5 5 5 19 | 10 10 | 5 | 11 5 | 12 6 | 8 4 | 9 8 4 | 41 12 | 38 38 39 19 19 |
Shipments by markets do not include workstations.
Source: Company data, Goldman Sachs Global Investment Research e92c7a75ab8b4efbba794e6b187208c8
圖片清單(已驗證 2026-07-02)
回補驗證:僅涵蓋已被 lib 頁嵌入的圖片,非全量驗證。
| 檔名 | size | 分類 | 親眼所見內容 |
|---|---|---|---|
260620_全球智慧型手機_gs_global-smartphones_001.png |
35KB | 真資料圖 | 全球智慧型手機出貨量長條圖+YoY%折線,橫軸2021-2028E,縱軸左1000-1400(m units)、右-14%~8%,深藍柱為「Global smartphone shipment (m units)」,淺藍線為「YoY% (RHS)」 |