報告_花旗_研華_20260506
PDF 原檔:報告_花旗_研華_20260506_original.pdf
原始內容
(RIC: 2395.IW, BB: 2395 11)
TWD
400
380
360
340
320
300
280
260
06 May 2026 10:02:05 ET │ 14 pages
Jun
Sep
Dec
Mar
Advantech (2395.TW)
Demand Improves yet Cost Pressure Lingers; Maintain Neutral
CITI’S TAKE
1Q26 beat was helped by stronger sales and op leverage, with net profits up 22% y/y. Order book improved meaningfully with 1Q26 BB ratio rising to 1.77x, up from 1.33x in 4Q25, supporting the mgmt’s 2Q26E sales guidance of low teens y/y. Edge AI remains on track, making up 20.5% in 1Q26 toward 30% FY26E target. We expect component tightness across memory, CPU, SSD and PCB to continue to pressure costs, despite more active pricing adjustments. We raise 26E/27E EPS by 12%/8% and TP to NT$405 (28x 26E P/E). Maintain Neutral as valuation appears to reflect most positives.
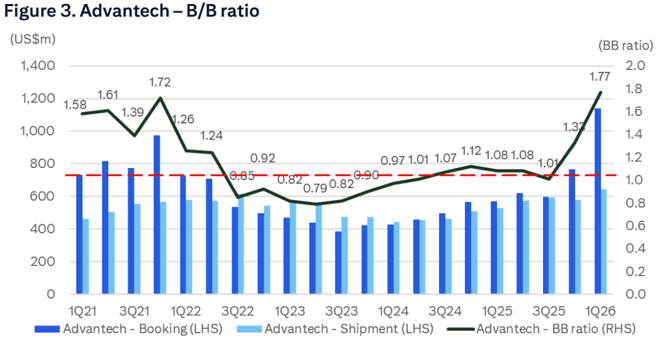
1Q26 results beat -Net profit of NT$3.3bn rose 22% y/y topping BBG estimates 20% driven by strong top line and op leverage. GPM of 39.1% dipped 1.4ppt y/y hampered by component cost inflation. With a strong op leverage on a larger sales scale, OPM expanded 1.4ppt y/y to 18.3%, higher than the co’s guidance of 16-18%. Group BB ratio improved significantly to 1.77x in 1Q26, up from 4Q25’s 1.33 driven mostly by a broad-based recovery across major markets (NA, EU and China).
2Q26E guidance - sales better, in-line margins -The mgmt. guided 2Q26E revenue to grow low teens y/y to US$650-670mn (FX: 1:31.5), 2-6% higher than the BBG’s estimates, while margins guidance (GPM 38-40%; OPM 16-18%) is in-line. The mgmt. continues to observe strong demand from semi equipment, medical equipment, automation and transportation projects.
Supply chain tightness driving earlier orders -Advantech noted customers have been placing early orders to secure the products due to the ongoing supply tightness across memory, CPU, SSD and PUB, boosting higher BB ratio in recent months. Edge AI made up 20.5% of group sales, on track to the guidance of 30% by end-2026E.
Implications -We raise our 2026E/27E earnings estimates by 12%/8% to factor in the results and guidance. We lift our TP to NT340 prior) based on 28x 2026E P/E, benchmarked with the stock’s mid-cycle valuation since 2020. We like Advantech’s leading position in IPC and edge AI applications, yet we think the recent share price rally has baked in most positives including strong BB ratio and solid sales/demand outlook. Ongoing component tightness continues to be a near-term overhang on margins, in our view. The stock is trading at 29x on 2026E P/E against 15% earnings growth, which does not appear attractive to us.
Earnings Summary
| Year to 31Dec | Net Profit (NT$M) | DilutedEPS (NT$) | EPSgrowth (%) | P/E (x) | P/B (x) | ROE (%) | Yield (%) |
|---|---|---|---|---|---|---|---|
| 2024A | 9,005 | 10.46 | -19.2 | 39.2 | 6.9 | 18 | 2.1 |
| 2025A | 10,593 | 12.26 | 17.2 | 33.4 | 6.5 | 19.9 | 2.2 |
| 2026E | 12,188 | 14.1 | 15 | 29 | 5.9 | 21.2 | 2.5 |
| 2027E | 13,606 | 15.74 | 11.6 | 26 | 5.4 | 21.7 | 2.8 |
| 2028E | 15,322 | 17.72 | 12.6 | 23.1 | 5 | 22.4 | na |
Source: Powered by dataCentral
See Appendix A-1 for Analyst Certification, Important Disclosures and Research Analyst Affiliations.
n Neutral
Price (06 May 26 13:30)
NT$409.50
Target price
NT$405.00↑
from NT$340.00
Expected share price return
-1.1%
Expected dividend yield
3.1%
Expected total return
2.0%
Market Cap
NT11,232M
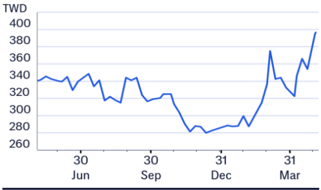
Price Performance (RIC: 2395.TW, BB: 2395 TT)
Angela Hsu AC
+886-2-8726-9083 angela.hc.hsu@citi.com
| 2395.TW: Fiscalyearend31-Dec | Price:NT405.00; | MarketCap:NT$354,557m; Recomm:Neutral | MarketCap:NT$354,557m; Recomm:Neutral | MarketCap:NT$354,557m; Recomm:Neutral | MarketCap:NT$354,557m; Recomm:Neutral | MarketCap:NT$354,557m; Recomm:Neutral | |||||
|---|---|---|---|---|---|---|---|---|---|---|---|
| Profit&Loss(NT$m) | 2024 | 2025 | 2026E | 2027E | 2028E | Valuation ratios | 2024 | 2025 | 2026E | 2027E | 2028E |
| Sales revenue | 59,786 | 70,882 | 80,296 | 89,498 | 99,790 | PE(x) | 39.2 | 33.4 | 29.0 | 26.0 | 23.1 |
| Cost of sales | -35,410 | -42,685 | -48,851 | -53,958 | -59,926 | PB(x) | 6.9 | 6.5 | 5.9 | 5.4 | 5.0 |
| Gross profit | 24,376 | 28,198 | 31,445 | 35,540 | 39,864 | EV/EBITDA(x) | 31.9 | 25.3 | 21.7 | 19.2 | 16.8 |
| Gross Margin (%) | 40.8 | 39.8 | 39.2 | 39.7 | 39.9 | FCFyield (%) | 1.9 | 2.2 | 3.7 | 3.4 | 4.1 |
| EBITDA(Adj) | 9,984 | 12,559 | 14,484 | 16,160 | 18,140 | Dividend yield (%) | 2.1 | 2.2 | 2.5 | 2.8 | na |
| EBITDAMargin(Adj) (%) | 16.7 | 17.7 | 18.0 | 18.1 | 18.2 | Payout ratio (%) | 80 | 73 | 73 | 73 | 0 |
| Depreciation | -934 | -992 | -1,006 | -995 | -995 | ROE(%) | 18.0 | 19.9 | 21.2 | 21.7 | 22.4 |
| Amortisation | 0 | 0 | 0 | 0 | 0 | Cashflow(NT$m) | 2024 | 2025 | 2026E | 2027E | 2028E |
| EBIT (Adj) | 9,050 | 11,567 | 13,478 | 15,164 | 17,144 | EBITDA | 9,984 | 12,559 | 14,484 | 16,160 | 18,140 |
| EBIT Margin (Adj) (%) | 15.1 | 16.3 | 16.8 | 16.9 | 17.2 | Working capital | -1,136 | -406 | 1,032 | -1,507 | -870 |
| Net interest | 294 | 252 | 410 | 465 | 574 | Other | -162 | -1,066 | -1,354 | -1,621 | -1,886 |
| Associates | -176 | -102 | 150 | 175 | 175 | Operating cashflow | 8,686 | 11,086 | 14,163 | 13,031 | 15,384 |
| Non-Op/Except/Other Adj | 1,807 | 972 | 740 | 700 | 700 | Capex | -1,852 | -3,200 | -1,011 | -1,000 | -1,000 |
| Pre-tax profit | 10,975 | 12,690 | 14,778 | 16,504 | 18,594 | Net acq/disposals | -125 | -97 | -150 | -175 | -175 |
| Tax | -2,086 | -2,189 | -2,653 | -2,962 | -3,336 | Other | -829 | -1,375 | 0 | 0 | 0 |
| Extraord./Min.Int./Pref.div. | 117 | 92 | 64 | 64 | 64 | Investing cashflow | -2,806 | -4,672 | -1,161 | -1,175 | -1,175 |
| Reported net profit | 9,005 | 10,593 | 12,188 | 13,606 | 15,322 | Dividends paid | -8,120 | -7,252 | -7,740 | -8,906 | -9,943 |
| Net Margin (%) | 15.1 | 14.9 | 15.2 | 15.2 | 15.4 | Financing cashflow | -5,983 | -7,473 | -7,254 | -8,201 | -9,157 |
| CoreNPAT | 9,005 | 10,593 | 12,188 | 13,606 | 15,322 | Net change in cash | -102 | -1,059 | 5,748 | 3,655 | 5,052 |
| Per share data | 2024 | 2025 | 2026E | 2027E | 2028E | Free cashflow to s/holders | 6,834 | 7,886 | 13,152 | 12,031 | 14,384 |
| Reported EPS($) | 10.46 | 12.26 | 14.10 | 15.74 | 17.72 | ||||||
| Core EPS($) | 10.46 | 12.26 | 14.10 | 15.74 | 17.72 | ||||||
| DPS($) | 8.40 | 8.94 | 10.29 | 11.48 | 0 | ||||||
| CFPS($) | 10.09 | 12.83 | 16.38 | 15.07 | 17.80 | ||||||
| 7.94 | 9.13 | 15.21 | 13.92 | ||||||||
| FCFPS() | 59.55 | 63.46 | 69.26 | 75.43 | 16.64 82.48 | ||||||
| Wtdavgordshares(m) | 861 | 864 | 864 | 864 | 864 | ||||||
| Wtdavgdiluted shares (m) | 861 | 864 | 864 | 864 | 864 | ||||||
| Growthrates | 2024 | 2025 | 2026E | 2027E | 2028E | ||||||
| Sales revenue (%) | -7.4 | 18.6 | 13.3 | 11.5 | 11.5 | ||||||
| EBIT (Adj) (%) | -25.4 | 27.8 | 16.5 | 12.5 | 13.1 | ||||||
| CoreNPAT(%) | -16.9 | 17.6 | 15.1 | 11.6 | 12.6 | ||||||
| CoreEPS(%) | -19.2 | 17.2 | 15.0 | 11.6 | 12.6 | ||||||
| BalanceSheet(NT$m) | 2024 | 2025 | 2026E | 2027E | 2028E | ||||||
| Cash&cashequiv. | 19,528 | 18,470 | 24,217 | 27,872 | 32,925 | ||||||
| Accounts receivables | 10,124 | 10,535 | 12,042 | 14,306 | 15,871 | ||||||
| Inventory | 10,554 | 11,835 | 12,142 | 14,257 | 15,804 | ||||||
| Net fixed &other | 12,244 | 14,452 | 14,456 | 14,461 | 14,466 | ||||||
| tangibles Goodwill &intangibles | 0 | 0 | 0 | 0 | 0 | ||||||
| Financial &other assets | 19,292 | 20,426 | 20,733 | 21,140 | 21,538 | ||||||
| Total assets | 71,742 | 75,718 | 83,591 | 92,036 | 100,603 | ||||||
| Accounts payable | 6,911 | 7,681 | 8,308 | 9,980 | 11,063 | ||||||
| Short-term debt | 0 | 0 | 0 | 0 | 0 | ||||||
| Long-term debt | 156 | 150 | 0 | 0 | 0 | ||||||
| Provisions &other liab | 12,878 | 12,837 | 15,213 | 16,644 | 18,027 | ||||||
| 19,945 | 20,668 | 23,521 | 29,090 | ||||||||
| Total liabilities | 51,428 | 26,624 | 71,412 | ||||||||
| Shareholders’ equity Minority interests | 369 | 54,947 102 | 59,968 102 | 65,310 102 | 102 | ||||||
| Total equity | 51,797 | 55,049 | 60,070 | 65,412 | 71,514 | ||||||
| Net debt (Adj) | -19,372 | -18,319 | -24,217 | -27,872 | -32,925 | ||||||
| Net debt to equity (Adj) (%) | -37.4 | -33.3 | |||||||||
| For definitions of the items in this table, | please click here. | -40.3 | -42.6 | -46.0 |
Figure 1. Advantech: 1Q26 Earnings Comp
| NT$mn | 1Q26 Actual | 4Q25 Actual | Q/Q | 1Q25 Actual | Y/Y | 1Q26 BBG | Diff. |
|---|---|---|---|---|---|---|---|
| Revenue | 20,385 | 17,921 | 14% | 17,351 | 17% | 18,937 | 8% |
| COGS | 12,405 | 10,792 | 10,323 | ||||
| Gross profit | 7,980 | 7,129 | 12% | 7,028 | 14% | 7,423 | 7% |
| Opex | 4,251 | 4,318 | 4,104 | ||||
| Op.profit | 3,728 | 2,811 | 33% | 2,924 | 28% | 3,165 | 18% |
| Totalnon-opincome | 340 | 870 | 316 | ||||
| Pre-tax profit | 4,068 | 3,681 | 11% | 3,240 | 26% | 3,378 | 20% |
| Netincome | 3,334 | 3,103 | 7% | 2,734 | 22% | 2,786 | 20% |
| EPS(NT$) | 3.86 | 3.59 | 7% | 3.17 | 22% | 3.20 | 21% |
| Margins (%) | |||||||
| GPM | 39.1 | 39.8 | (0.6) | 40.5 | (1.4) | 39.2 | (0.1) |
| OPM | 18.3 | 15.7 | 2.6 | 16.9 | 1.4 | 16.7 | 1.6 |
| OPEXRatio | 20.9 | 24.1 | (3.2) | 23.7 | (2.8) | 0.0 | 20.9 |
| NetMargin | 16.4 | 17.3 | (1.0) | 15.8 | 0.6 | 14.7 | 1.6 |
Source: Company Reports, Bloomberg, Citi Research, Citi Research Estimates
Figure 2. Advantech: Earnings Estimates Revisions
| 2026E | 2026E | 2026E | 2027E | 2027E | 2027E | 2028E | |
|---|---|---|---|---|---|---|---|
| (NT$mn) | New | Old | Chg. | New | Old | Chg. | New |
| Sales | 80,296 | 77,170 | 4% | 89,498 | 85,658 | 4% | 99,790 |
| Gross profit | 31,445 | 30,246 | 4% | 35,540 | 34,108 | 4% | 39,864 |
| Opex | 17,967 | 18,033 | 0% | 20,376 | 19,937 | 2% | 22,720 |
| Operatingprofit | 13,478 | 12,213 | 10% | 15,164 | 14,171 | 7% | 17,144 |
| Pre-tax profit | 14,778 | 13,275 | 11% | 16,504 | 15,337 | 8% | 18,594 |
| Netincome | 12,188 | 10,888 | 12% | 13,606 | 12,575 | 8% | 15,322 |
| EPS(NT$) | 14.10 | 12.60 | 12% | 15.74 | 14.55 | 8% | 17.72 |
| Margins (%) | |||||||
| Gross margin | 39.2 | 39.2 | 0.0 | 39.7 | 39.8 | -0.1 | 39.9 |
| Opexratio | 22.4 | 23.4 | -1.0 | 22.8 | 23.3 | -0.5 | 22.8 |
| Operatingmargin | 16.8 | 15.8 | 1.0 | 16.9 | 16.5 | 0.4 | 17.2 |
| Netmargin | 15.2 | 14.1 | 1.1 | 15.2 | 14.7 | 0.5 | 15.4 |
© 2026 Citigroup Inc. No redistribution without Citigroup’s written permission.
Source: Citi Research, Citi Research Estimates
Figure 3. Advantech - D/D ratio
(US$m)
1,400
1,200
1,000
800
600
400
200
1Q21 3Q21
1Q22
0.92
0-85-0.820.790.829-92-
3Q22
• Advantech - Booking (LHS)
0.97 1.01 1.07 1.12 1.08 1.08 1.0
3Q23
1Q23
(BB ratio)
1.77
2.0
1.8
1.6
1.4
1.2
1.0
1Q24 3Q24 + 1Q25
Advantech - Shipment (LHS) —Advantech - BB ratio (RHS)
© 2026 Citigroup Inc. No redistribution without Citigroup’s written permission. Source: Company Reports, Citi Research
1.58
1.61
1.39
1.26
1.24
1.3
NT$
468
390
312
234
May 25
A 14% Upside
NT$ 405.00
• 1.1% Downside
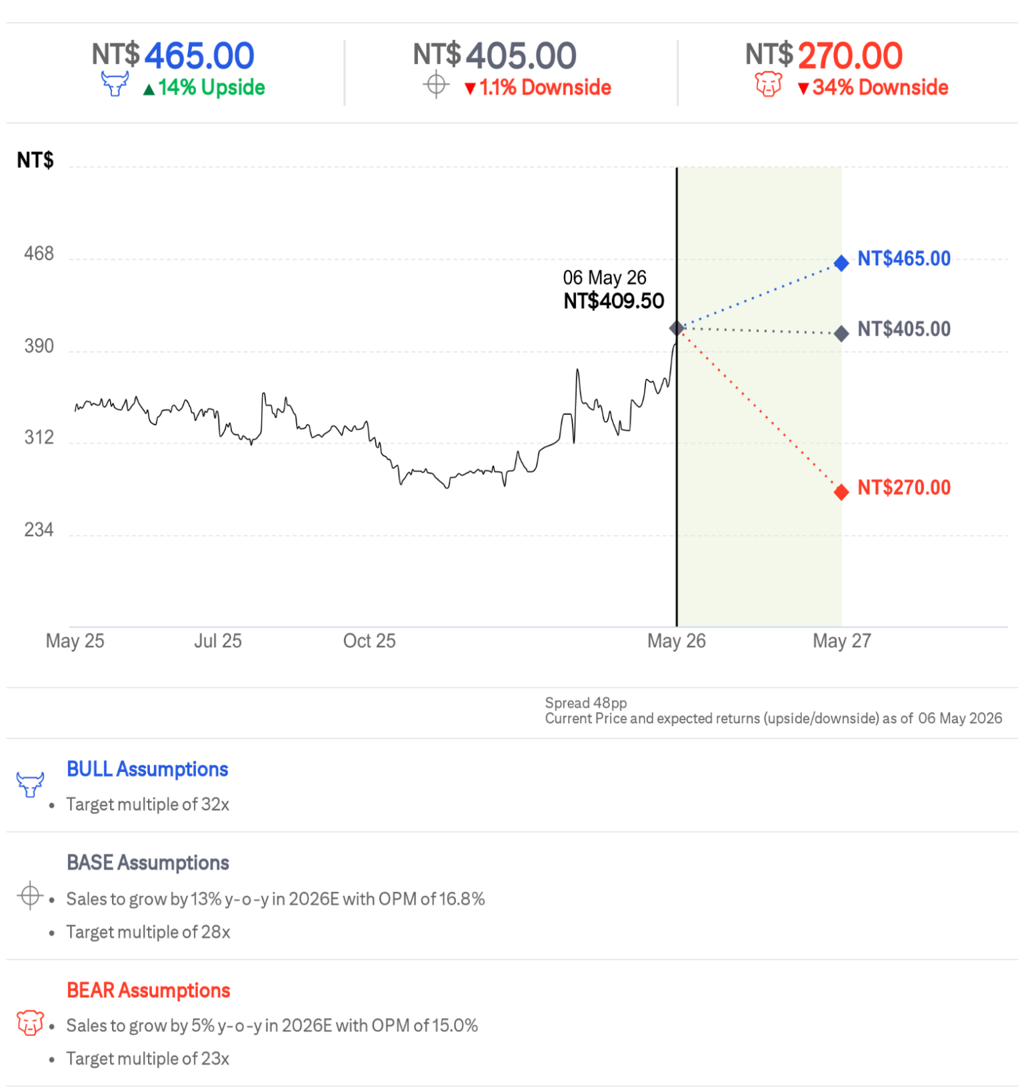
Bull/Bear: Advantech (2395.TW)
NT$ 270.00
• 34% Downside
Advantech
Company description
Advantech, established in 1981, is the largest Industrial PC company globally in terms of sales. Through a series of M&As and alliances, it has established strong domain know-how across various verticals and its diversified customer base, and it provides broad product offerings ranging from single boards, industrial handheld devices, industrial automation equipment, transportation controlling systems, and smart city solutions. North America and China are its largest markets.
Investment strategy
We rate Advantech shares at Neutral. We think the company’s relatively stable margins and improving ROE, as well as demand recovery from major markets should help support the share price performance. However, as these catalysts are likely reflected in the price, we think further upside would take a more broad-based demand recovery to justify.
Valuation
Our target price of NT$405 is based on 28x 2026E EPS, at the mid-cycle of the stock’s valuation range between 20-35x since 2020, reflecting improving margin profile and ROE.
Risks
Key upside risks that could cause Advantech’s shares to trade above our target price include: 1) better-than-expected marcoeconomic outlook; and 2) better-than-expected demand and margin profile. Key downside risks would include: 1) slower-than-expected demand recovery, especially the China market; and 2) further deterioration of demand in US and EU markets.
If you are visually impaired and would like to speak to a Citi representative regarding the details of the graphics in this document, please call USA 1-888-500-5008 (TTY: 711), from outside the US +1-210-677-3788