PDF 原檔:260622_中國__GPU _TAMms_china-AI-GPU-TAM_original.pdf
原始內容
M June 22, 2026 09:07 AM GMT
Tracking China's Semi Localization | Asia Pacific
Raising China AI GPU TAM on recent geopolitical dynamics
The recent tightening of US export controls for China's overseas entities may create a new TAM for China's AI GPU.
Recent news regarding halting of AI chip shipments to Chinese firms outside of China poses a 'bull case' scenario for China AI GPU: in early June, news reported that the US Department of Commerce had moved to close a potential loophole that may have led companies to export the world's most advanced chips - such as NVIDIA's most sophisticated Blackwell processors - to subsidiaries of Chinese companies located outside China. We think that, in the short term, China CSPs may turn to more GPU rental to fulfill the strong computing demand, while in the midto-longer term, it is likely that China AI GPU may potentially see overseas adoption, which is the bull base we argue in our China AI GPU Insight report.
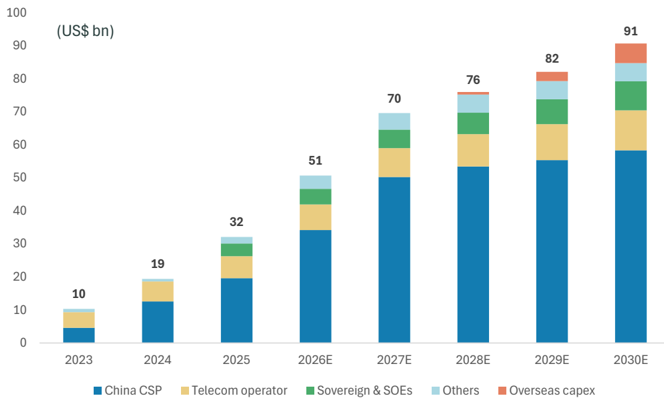
We raise our forecast of China's AI chip TAM to US$91bn by 2030 , up 36%, from US$67bn previously, implying a 23% CAGR over 2025-30. The upward revision is mainly because of: 1) Adding 'CSP's overseas capex' as the new TAM; 2) Bytedance's plan to sharply increase its capital spending in 2026 and 2027 (link); 3) the addition of Kingsoft Cloud to the database; and 4) revised up sovereign and SOE-related TAM on back of government advocacy to increase spending on AI infrastructure.
Domestic AI infrastructure enters a critical deployment window: Our recent field trip in China in suggests that despite ongoing capacity expansion, major CSPs continue to face compute shortages, while vendor qualification activity is accelerating. We believe 2026 will be a critical year for domestic suppliers to enter CSP procurement systems, with competition increasingly driven by ecosystem maturity, software optimization and cluster deployment capabilities. On the supply side, access to leading-edge foundry capacity remains a key differentiator. Vendors approved for CCATS (Commodity Classification Automated Tracking System) with BIS (Bureau of Industry and Security ) are allowed access to TSMC manufacturing and generally benefit from better cost and power efficiency, for example 7nm/6nm node for Iluvatar. Meanwhile, domestic advanced-node capacity continues to ramp. Industry participants expect a more stable local supply chain to emerge in 2027-28 other than SMIC South, supporting broader adoption of domestic AI infrastructure.
Stock implications - OW China GPU companies, fab and semicap plays: We like Cambricon (OW) - we raise our PT to Rmb1,528 , and Iluvatar CoreX (OW) -we raise our PT to HK$688 on back of stronger China CSP demand; we also like SMIC (0981.HK, OW) and Hua Hong (1347.HK, EW) as key enablers of China's AI localization. We are constructive on Chinese semi equipment Naura (002371.SZ), AMEC (688012.SS) and ACMR (ACMR.O) - on their positioning in China's accelerating semiconductor localization cycle; and ASMPT (0522.HK) as an enabler of China advanced packaging.
Idea
| Morgan Stanley Taiwan Limited+ | |
|---|---|
| Charlie Chan Equity Analyst Charlie.Chan@morganstanley.com | +886 2 2730-1725 |
| Daniel Yen, CFA Equity Analyst Daniel.Yen@morganstanley.com | +886 2 2730-2863 |
| Daisy Dai, CFA Equity Analyst Daisy.Dai@morganstanley.com | +852 2848-7310 |
| Equity Analyst Tiffany.Yeh@morganstanley.com Morgan Stanley Asia Limited+ | +886 2 7712-3032 |
| Henry Zhao Research Associate Henry.Zhao@morganstanley.com | +852 2239-7731 |
| Ethan Jia Research Associate Ethan.Jia@morganstanley.com Morgan Stanley Taiwan Limited+ | +852 3963-2287 |
| Lucas Wang Research Associate Lucas.Wang@morganstanley.com | +886 2 2730-2875 |

Greater China Technology Semiconductors
Asia Pacific
Industry View
Attractive
| What's Changed Cambricon Technology Corporation (688256.SS) Price Target | From Rmb1,342.28 | To Rmb1,528.00 |
|---|---|---|
| Iluvatar CoreX Semiconductor Co., Ltd. (9903.HK) Price Target | From HK$600.00 | To HK$688.00 |
Morgan Stanley does and seeks to do business with companies covered in Morgan Stanley Research. As a result, investors should be aware that the firm may have a conflict of interest that could affect the objectivity of Morgan Stanley Research. Investors should consider Morgan Stanley Research as only a single factor in making their investment decision.
For analyst certification and other important disclosures, refer to the Disclosure Section, located at the end of this report.
+= Analysts employed by non-U.S. affiliates are not registered with FINRA, may not be associated persons of the member and may not be subject to FINRA restrictions on communications with a subject company, public appearances and trading securities held by a research analyst account.
M
China AI GPU market TAM
China's AI GPU demand is concentrated across a small number of large buyer groups, whose capex decisions ultimately define the size of the addressable market.
- The first group comprises China's CSPs - including ByteDance, Alibaba and Tencent - which procure AI chips both to train and run inference on proprietary models and to deploy AI infrastructure for external cloud customers.
- The second group includes China's telecom operators, SOEs and municipal governments - the so -called sovereign -AI buyers - where demand is driven by national AI infrastructure build -out, data sovereignty, and public -sector applications.
- AI start -ups (e.g., DeepSeek, MiniMax) and auto OEMs (e.g., Xpeng, Xiaomi) also purchase AI chips, although their volumes currently remain smaller than those of the first two groups.
We forecast China's AI chip TAM to reach US$91bn by 2030 up 36% from US$67bn previously, implying a 23% CAGR over 2025-30 . The upward revision is mainly because:
- We added new category (China CSP's overseas AI data center using local GPU). In the short term, China CSPs may turn to more GPU rental to fulfill the strong computing demand, while in the mid-to-longer term, it is likely that China AI GPU may potentially see overseas adoption. Therefore we assume that part to be zero until 2027, but from 2028 onwards, we expect 3%/10%/20% of overseas capex to be addressed by local CPU in 2028/29/30.
- Bytedance is planning to sharply increase its capital spending in 2026 and 2027 in a bid to lead the Chinese artificial intelligence market and challenge the top US players abroad - the news reported that 2027 capex could be US$100 bn if economic and business conditions are favourable, we put US$80bn (~Rmb542bn) to build in some conservatism.
- We added Kingsoft Cloud to the database, its capex surged to Rmb3bn, with fullyear 2026 capital investments projected to exceed Rmb15-20bn to meet explosive AI and cloud demand.
- We revised up sovereign and SOE-related TAM to US$9bn up from US$7bn previously. Recent news ( Bloomberg , Jun 9) reported that China is preparing Rmb2tn over the next five years for building data centres across the country, so far we did not see specific government guidance, but directionally SOE and local government will spend more on AI infrastructure.
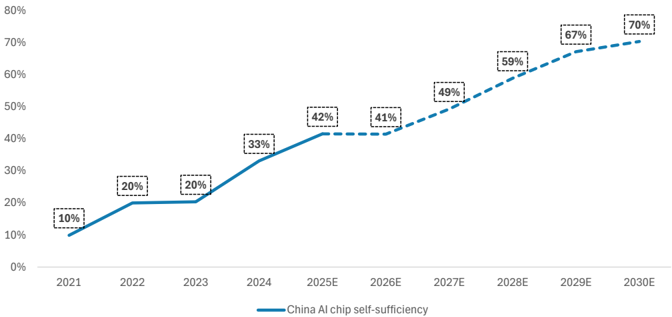
We expect China's AI -chip self -sufficiency to rise from 42% in 2025 to 70% in 2030e. We expect leading -node -capacity expansion and continued chip -performance improvement to drive local AI -chip revenue growth.
M
Exhibit 1: We expect China AI chip TAM to grow to US$91bn by 2030E
Source: Company data, Morgan Stanley Research (E) estimates
Exhibit 2: We expect China AI chip self-sufficiency to reach 70% in 2030E
Source: Company data, Morgan Stanley Research (e) estimates
M
China Semi Equipment Import Trends
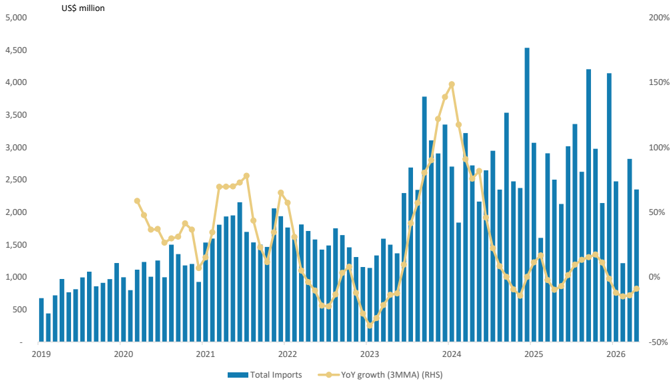
China's semi equipment import value was US$2.4bn in Apr 2026, down 6% Y/Y. On a three-month moving average basis, the Y/Y growth was -9%, up from the -14% YoY in Mar 2026 ( Exhibit 3 ). Our US team expects China WFE to grow at 16% yoy in 2026, to US $48bn, mainly driven by memory and leading-node capacity expansion (link). We expect local equipment vendors to further gain market share on the back of an increasing China WFE TAM.
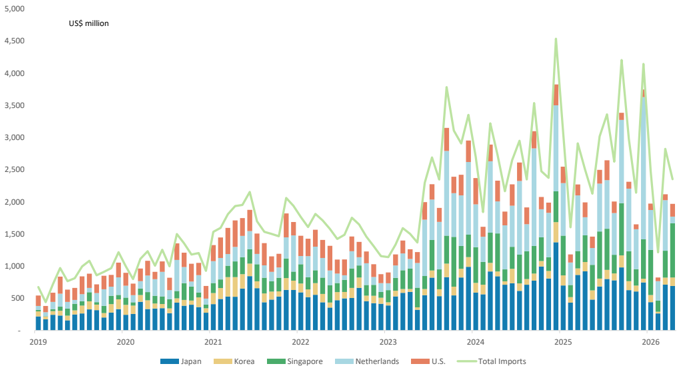
YTD, import values from the US, Netherlands, Korea and Japan have all decreased: -43%, 22%, -23% and -28% Y/Y, respectively. Only import from Singapore was up 43% YoY.
Exhibit 3: Growth in China's semi equipment imports declined to -9% Y/Y (3MMA) in Apr 2026
Source: China's General Administration of Customs, Morgan Stanley Research.
Exhibit 4: Semi equipment imports from most major countries was down yoy (YTD)
Source: China's General Administration of Customs, Morgan Stanley Research.
M
Monthly Performance and Catalysts
Outperformers: ACMR +49.2%, Gigadevice +36.2%, JCET +24.8%
Underperformers: Shanghai Fudan -38.4%, USI -20.7%, Maxscend -18.3%
Over the past month, ACMR has outperformed, because of strong demand from memory clients and, in our view, because Huawei's LogicFolding process will drive increased adoption of ECP for TSV metallization, catalyzing rapid growth in ACMR's non-wet cleaning tool business (link). For Gigadevice, we see recent developments for servers (for high performance NAND) suggest potential adoption of SLC in datacenters, as SLC is ideal for fast reading and writing speed, Gigadevce is one of the beneficiary of this trend. Also NOR is seeing more tightness on mature foundry shortages (link).
Among the underperformers, Shanghai Fudan's share price saw a decline of 38.4% in the past month on corrected sentiment toward low earth orbit satellites, as carrier rockets are not yet recyclable. Also, USI share price declined by 20.7%, reflect market concern regarding delays in CPO introduction (link).
M
Exhibit 5: Share price performance of key Chinese semi localization stocks
| Price (loc) | Mkt Cap (US$ mn) | Stock Rating | 1M | 3M Performance | 12M | YTD | ||
|---|---|---|---|---|---|---|---|---|
| Foundry | ||||||||
| 0981.HK | SMIC | 71.65 | 91,921 | O | (6.5%) | 13.5% | 75.6% | 0.3% |
| 1347.HK | Hua Hong Semiconductor Ltd | 139.20 | 36,794 | E | 7.5% | 46.5% | 366.3% | 87.3% |
| Backend | ||||||||
| 601231.SS | Universal Scientific Ind. (Shanghai) | 33.90 | 11,978 | O | (20.7%) | (13.3%) | 136.9% | 13.0% |
| 600584.SS | JCET | 68.92 | 18,240 | E | 24.8% | 50.7% | 114.6% | 87.4% |
| AI GPU | ||||||||
| 688256.SS | Cambricon Technology Corporation | 1,240.00 | 115,226 | O | (3.0%) | 68.1% | 205.5% | 36.3% |
| 9903.HK | Iluvatar CoreX Semiconductor Co., Ltd. | 528.00 | 17,136 | O | 1.5% | 67.6% -- | -- | |
| 688802.SS | MetaX Integrated Circuits | 694.89 | 41,120 | E | (10.6%) | 33.6% -- | 19.8% | |
| Equipment | ||||||||
| ACMR.O | ACM Research Inc | 93.95 | 6,493 | O | 49.2% | 107.5% | 265.2% | 138.1% |
| 0522.HK | ASMPT Ltd | 182.90 | 9,789 | O | 3.8% | 67.3% | 236.5% | 136.2% |
| 688012.SS | Advanced Micro-Fabrication Equipment Inc | 303.92 | 42,059 | O | 16.6% | 43.6% | 172.8% | 66.0% |
| 002371.SZ | NAURA Technology Group Co Ltd | 667.19 | 71,582 | O | 14.7% | 45.7% | 122.8% | 45.3% |
| Analog | ||||||||
| 300661.SZ | SG Micro Corp. | 111.44 | 10,290 | E | 7.8% | 49.0% | 57.7% | 62.4% |
| Smartphone Semis | ||||||||
| 300782.SZ | Maxscend Microelectronics Co Ltd | 89.76 | 7,633 | U | (18.3%) | 9.6% | 27.3% | 10.2% |
| 603501.SS | OmniVision Integrated Circuits Group Inc | 86.01 | 15,871 | E | (16.7%) | (23.8%) | (31.5%) | (31.7%) |
| 603160.SS | Shenzhen Goodix Technology Co Ltd | 55.99 | 3,858 | U | (15.6%) | (22.4%) | (17.6%) | (29.1%) |
| Consumer Semis | ||||||||
| 688018.SS | Espressif Systems | 112.00 | 3,883 | O | (9.8%) | 1.7% | 14.5% | (7.8%) |
| Memory | ||||||||
| 603986.SS | GigaDevice Semiconductor Beijing Inc | 481.47 | 50,330 | O | 36.2% | 75.2% | 301.4% | 124.7% |
| Cloud Semis 688008.SS | Montage Technology Co Ltd -A | 224.88 | 41,563 | O | (6.6%) | 52.1% | 176.7% | |
| Power Semis/SiC | ||||||||
| 6809.HK | Montage Technology Co Ltd -H | 355.00 | 41,563 | O | (14.0%) | 91.4% -- | -- | 90.9% |
| 603290.SS | StarPower Semiconductor Ltd | 60.80 109.00 | 11,944 3,861 | E | (3.7%) | (0.1%) | 36.3% | 13.4% |
| 300373.SZ | Yangjie Technology | 96.68 | 7,787 | O | 23.3% | 22.6% | 97.8% | 42.2% |
| 600460.SS | Hangzhou Silan Microelectronics Co. Ltd. | 32.15 | 7,913 | U | 6.4% | 10.9% | 35.0% | 13.2% |
| Co Ltd | 8,454 | O | 48.9% | |||||
| 688234.SS | SICC | 123.70 | (4.9%) | 120.4% | 39.2% | |||
| EDA/IP | ||||||||
| 301269.SZ | Empyrean Technology Co Ltd | 94.57 | 7,629 | E | (1.3%) | (0.3%) | (19.3%) | (11.1%) |
| FPGA | ||||||||
| 002049.SZ | Unigroup Guoxin Microelectronics Co Ltd | 71.51 | 8,986 | U | (10.2%) | (4.9%) | 13.7% | (9.3%) |
| 1385.HK | Shanghai Fudan Microelectronics | 26.80 | 5,206 | O | (38.4%) | (37.0%) | (3.8%) | (40.9%) |
| (3.5%) | 1.9% | 22.7% | 3.2% | |||||
| CSI 300 SSE Composite | 4,777.32 4,031.51 | (4.3%) | (2.4%) | 18.5% | 1.6% |
Source: FactSet, Morgan Stanley Research. Note: Market data as of the close on Jun 12, 2026. Past performance is no guarantee of future results. Results shown do not include transaction costs.
M
Exhibit 6: 12-month share price performance, by segment
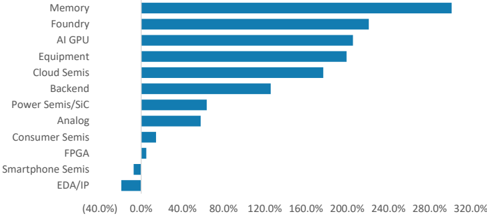
Source: FactSet, Morgan Stanley Research. Note: Market data as of the close on Jun 12, 2026. Past performance is no guarantee of future results. Results shown do not include transaction costs.
Exhibit 8:
Greater China semi localization stocks' performance trends
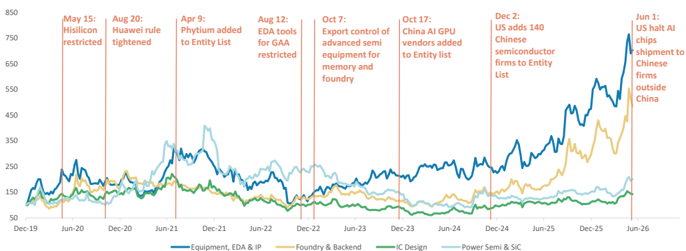
Source: FactSet, Morgan Stanley Research. Note: Market data as of the close on Jun 9, 2026. Past performance is no guarantee of future results. Results shown do not include transaction costs.
Catalysts and key events
| Date | Event | Location |
|---|---|---|
| July 17-20, 2026 | World Artificial Intelligence Conference | Shanghai, China |
| August 26-28, 2026 | AGIC Shenzhen Int'l AGI Conference & Expo | Shenzhen, China |
| Aug 31 - Sep 2, 2026 | Semiconductor Equipment, Materials and Core Parts Exhibition (CSEAC) | Wuxi China |
| Sept 9-11, 2026 | China International Optoelectronics Exposition & Int'l Integrated Circuit Innovation Expo | Shenzhen, China |
| Oct 14-16, 2026 | SemiBay | Shenzhen, China |
| Oct 27-29, 2026 | China Int'l Semiconductor Technology & Application Expo | Shenzhen, China |
| Nov 26-28, 2026 | China AI & Robot Industry Chain Expo | Shenzhen, China |
Exhibit 7: Key stocks' 12-month share price performance
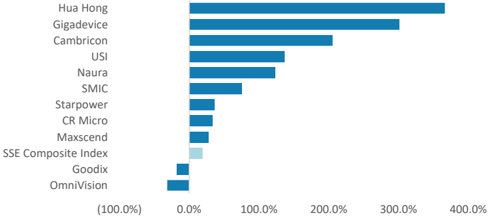
Source: FactSet, Morgan Stanley Research. Note: Market data as of the close on Jun 12, 2026. Past performance is no guarantee of future results. Results shown do not include transaction costs.
M
Cambricon: Earnings estimate revisions and quarterly financials
We raise our revenue forecasts 6% for 2026, 10% for 2027 and 9% for 2028: This primarily reflects our upgraded China AI accelerator market TAM. Cambricon, as one of the top players in this market, is likely to further benefited by the robust AI semi demand. We also see stable supply chain at SMIC for Cambricon, which could help the company to volume ship MLU580 and MLU690 in 2H26.
Given better product mix (higher contribution from more advanced AI chips like MLU690), we also lift our gross margin assumptions to 49.7%, and 49.2% (from 49.3%, and 48.7%) in 2027 and 2028. Therefore, we increase our EPS estimates 5%, 12%, and 12% for 2026, 2027, and 2028.
Exhibit 9: Cambricon: Earnings estimate revisions
| US$ mn | New '26 | Old'26E | Diff. | New '27 | Old'27E | Diff. | New '28 | Old'28E | Diff. |
|---|---|---|---|---|---|---|---|---|---|
| Net sales | 22,869 | 21,669 | 6% | 42,274 | 38,409 | 10% | 55,971 | 51,176 | 9% |
| Gross profit | 11,637 | 11,037 | 5% | 21,011 | 18,944 | 11% | 27,558 | 24,940 | 10% |
| Operating profit | 7,868 | 7,470 | 5% | 14,374 | 12,875 | 12% | 19,682 | 17,639 | 12% |
| Pretax Income | 7,776 | 7,377 | 5% | 14,451 | 12,952 | 12% | 19,750 | 17,707 | 12% |
| Net income | 7,332 | 6,973 | 5% | 12,283 | 11,009 | 12% | 16,788 | 15,051 | 12% |
| EPS for consensus | 12.39 | 11.82 | 5% | 19.45 | 17.44 | 12% | 26.59 | 23.84 | 12% |
| Margins | |||||||||
| Gross margin | 50.9% | 50.9% | 49.7% | 49.3% | 49.2% | 48.7% | |||
| Operating margin | 34.4% | 34.5% | 34.0% | 33.5% | 35.2% | 34.5% | |||
| Pretax margin | 34.0% | 34.0% | 34.2% | 33.7% | 35.3% | 34.6% | |||
| Net margin | 32.1% | 32.2% | 29.1% | 28.7% | 30.0% | 29.4% | |||
| Opex% | 16.5% | 16.5% | 15.7% | 15.8% | 14.1% | 14.3% |
Source: Morgan Stanley Research (e) estimates
Sxmun 1o. vatunuull. Yuat telly mlanlulalo
(Rmb mn)
Total revenues
1Q25
1,111.4
2Q25
1,769.2
3Q25
1,726.8
4Q25
1,889.8
1Q26
2,884.7
M
Gross Profit
622.3
936.6
Exhibit 10: Cambricon: Quarterly financials
Total Opex
Operating Income
Total Non-operating Income (loss)
Profit Before Taxes
Taxes
Total Net Income to Parent
EPS for consensus (Rmb)
Cauran. Camnanu data Marcon Ctanlou Doonarnh (al aatimato
1,035.7
54.8%
60.8%
1,567.3
54.3%
53.4%
2Q26E
3,871.7
34.2%
118.8%
1,858.4
48%
2,013.3
52.0%
45.2%
3Q26E
5,913.8
52.7%
242.5%
2,956.8
50%
2,957.0
50.0%
46.2%
4Q26E
10,198.8
72.5%
439.7%
5,099.3
50%
5,099.5
50.0%
50.0%
2025
6,497.2
0.0%
453.2%
2,913.9
45%
3,583.3
55.2%
54.8%
2026E 2027E 2028E
22,869.0
42,274.2
55,971.1
0.0%
252.0%
11,232.0
49%
11,637.1
50.9%
49.2%
0.0%
84.9%
21,262.7
50%
21,011.5
49.7%
48.3%
0.0%
32.4%
28,413.0
51%
27,558.0
49.2%
47.8%
| Percent of Revenues | 338.0 19.1% | 355.2 20.6% | 593.7 31.4% | 372.6 12.9% | 689.2 17.8% | 993.5 16.8% | 1,713.4 16.8% | 3,768.7 16.5% | 6,637.1 15.7% | 7,875.9 14.1% |
|---|---|---|---|---|---|---|---|---|---|---|
| R&D Percent of Revenues | 269.3 15.2% | 300.9 17.4% | 508.0 26.9% | 324.0 11.2% | 619.5 16.0% | 887.1 15.0% | 1,529.8 15.0% | 3,360.4 14.7% | 5,918.4 14.0% | 6,980.3 12.5% |
| General & Adm Exp. | 54.9 | 39.8 | 60.4 | 35.9 | 50.3 | 76.9 | 132.6 | 295.7 | 507.3 | 615.7 1.1% |
| Percent of Revenues | 3.1% | 2.3% | 3.2% | 1.2% | 1.3% | 1.3% | 1.3% | 1.3% | 1.2% | |
| Selling Expenses | 13.7 | 14.6 | 25.4 | 12.6 | 19.4 | 29.6 | 51.0 | 112.6 | 211.4 | 279.9 |
| Percent of Revenues | 0.8% | 0.8% | 1.3% | 0.4% | 0.5% | 0.5% | 0.5% | 0.5% | 0.5% | 0.5% |
| 650.8 | 581.3 | 442.1 | 1,194.6 | 1,324.2 | 1,963.5 | 3,303 1 | 7,868.3 | 14,374.4 | 19,682.2 | |
| Operating Margin | 36.8% | 33.7% | 23.4% | 41.4% | 34.2% | 33.2% | 34.4% | 34.0% | 35.2% | |
| 31.6 | (15.2) | 13.5 | (180.4) | 30.5 | 20.7 | 36.4 | (92.7) | 76.2 | 67.4 | |
| 682.4 | 566.1 | 455.5 | 1,014.2 | 1,354.7 | 1,984.2 | 3,422.5 | 7,775.6 | 14,450.6 | 19,749.6 | |
| Percent of Revenues | 38.6% | 32.8% | 24.1% | 35.2% | 35.0% | 33.6% | 33.6% | 34.0% | 34.2% | 35.3% |
| (0.0) | (0.3) | 1.1 | 1.4 | 99.2 | 342.2 | 443.9 | 2,167.6 | 2,962.4 | ||
| Tax Rate | 0.0% | 0.0% | 1.1 0.2% | 0.1% | 0.1% | 5.0% | 10.0% | 5.7% | 15.0% | 15.0% |
| 682.6 | 566.6 | 454.6 | 1,013.2 | 1,353.4 | 1,885.1 | 3,080.3 | 7,332.0 | 12,283.4 | 16,787.5 | |
| Percent of Revenues | 38.6% | 32.8% | 24.1% | 35.1% | 35.0% | 31.9% | 30.2% | 32.1% | 29.1% | 30.0% |
| 1.6 | 1.3 | 1.1 | 2.4 | 2.1 | 3.0 | 4.9 | 12.4 | 19.5 | 26.6 |
Source: Company data, Morgan Stanley Research (e) estimates
M
Cambricon: Valuation, raising price target to Rmb1,528
We continue to derive our price target (our base case scenario value) from a residual income model. The price target change reflects our EPS estimate revisions for 2026-28, driven by improved market TAM forecast and stabilized supply chain from local suppliers.
Key valuation assumptions remain the same: cost of equity of 8.4% (beta of 1.06, risk-free rate of 2%, and risk premium of 6%), intermediate growth rate of 16%, and terminal growth rate of 6.0%.
Our bull and bear case scenario values also rise from Rmb2,536.79 and Rmb676.21 to Rmb2,887 and Rmb770, respectively, implying 2026e P/S of 73x and 20x.
Exhibit 11: Cambricon: Residual income model
| Rmb million | 2026E | 2027E | 2028E | 2029E | 2030E | 2031E | 2032E | 2033E | 2034E | 2035E | 2036E | 2037E | 2038E |
|---|---|---|---|---|---|---|---|---|---|---|---|---|---|
| Total Equity | 18,675 | 29,459 | 43,746 | 55,469 | 69,068 | 84,843 | 103,141 | 124,367 | 148,990 | 177,552 | 210,684 | 249,117 | 293,699 |
| Net Profit | 7,332 | 12,283 | 16,788 | 19,474 | 22,589 | 26,204 | 30,396 | 35,260 | 40,901 | 47,445 | 55,036 | 63,842 | 74,057 |
| ROAE | 48.0% | 51.0% | 45.9% | 39.3% | 36.3% | 34.1% | 32.3% | 31.0% | 29.9% | 29.1% | 28.4% | 27.8% | 27.3% |
| Residual Income | 4,701 | 7,970 | 11,048 | 13,515 | 15,485 | 17,744 | 20,345 | 23,347 | 26,820 | 30,840 | 35,496 | 40,893 | 47,148 |
| Spread | 39.7% | 42.7% | 37.5% | 30.9% | 27.9% | 25.7% | 24.0% | 22.6% | 21.6% | 20.7% | 20.0% | 19.4% | 18.9% |
| Ending Equity Capital | 18,675 | ||||||||||||
| PV of Forecast Period | 138,265 | ||||||||||||
| PV of Continuing Value | 808,041 | ||||||||||||
| Equity Value | 964,981 | ||||||||||||
| No. of Shares | 631 | ||||||||||||
| Price Target | 1,528 |
Source: Company data, Morgan Stanley Research (e) estimates
Exhibit 12: Cambricon: One-year forward P/S trend
140x
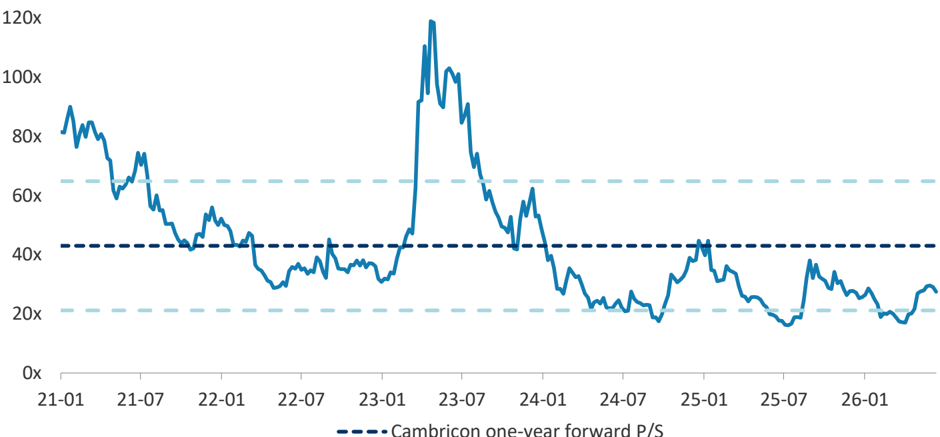
Source: Company data, FactSet, Morgan Stanley Research
Cambricon one-year forward P/S
M
Exhibit 13: Cambricon: One-year forward P/E trend
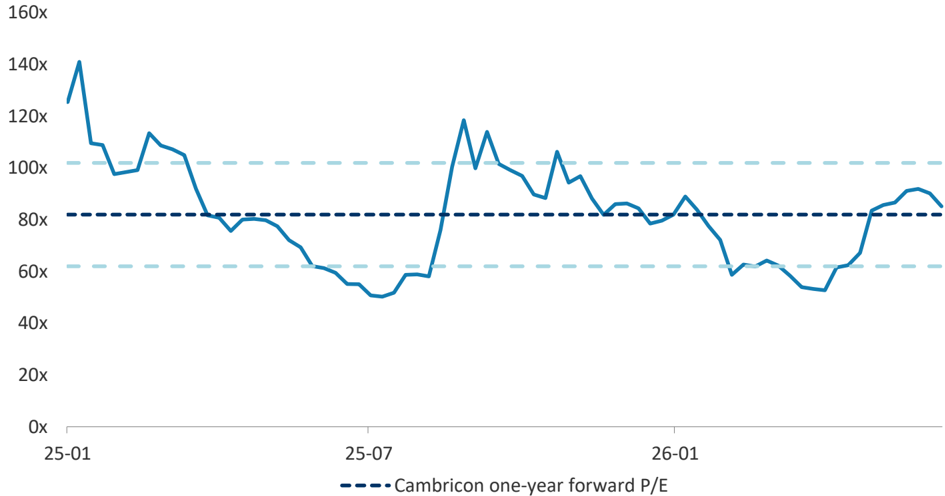
Source: Company data, FactSet, Morgan Stanley Research
M
Risk Reward - Cambricon Technology Corporation Risk Reward - Cambricon Technology Corporation (688256.SS)
(688256.SS) Raising China AI GPU TAM
Rmb1,528.00 PRICE TARGET
Key valuation assumptions underpinning our model include: an 8.4% cost of equity (derived from a beta of 1.06, risk-free rate of 2.0%, and equity risk premium of 6.0%), a long-term payout ratio of 40% (was 57%), a medium-term growth rate of 16%, and a terminal growth rate of 6.0%.
Rmb1,353.96
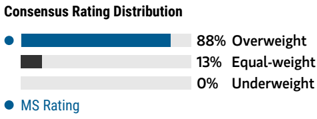
Consensus Price Target Distribution
Source: Refinitiv, Morgan Stanley Research
RISK REWARD CHART
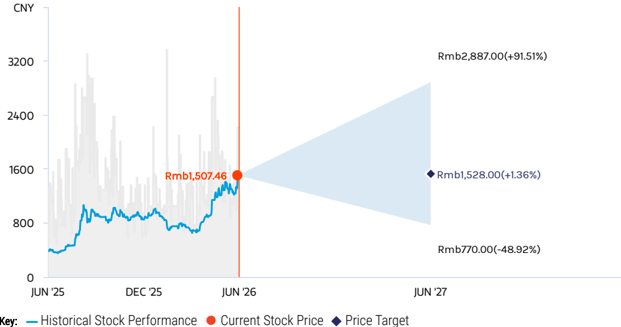
Source: Refinitiv, Morgan Stanley Research
BULL CASE
73x 2026e P/S
We assume (1) >130% revenue CAGR in 2025-28 driven by stronger-than-expected domestic generative AI infrastructure buildout and large-scale procurement of cloud training and inference chips; (2) sustained share gains in China's domestic highperformance AI chip market; (3) gross margin improves to over 55% in 2026 and 2027 thanks to production scale effects, mature technology iteration and optimized high-value product structure.
Rmb2,887.00
Rmb1,116.51
BASE CASE
39x 2026e P/S
We assume (1) 105% revenue CAGR in 202528 driven by domestic generative AI infrastructure spending from CSP clients; (2) gross margin reaches 51% and 50% in 2026 and 2027 given lower selling prices due to products with smaller die size.
Rmb1,614.77
MS PT
Mean
Morgan Stanley Estimates
Rmb1,528.00
OVERWEIGHT THESIS
- Cambricon has deep engagement with major CSPs with proven product-market fit. MLU590 is widely deployed in SAD workloads, supporting strong order visibility as AI infrastructure scales.
- Domestic supply chain transition is underway, with production shifting to SMIC. Yields remain a challenge, but we expect gradual improvement through 2026.
- Aggressive product roadmap, with nextgeneration MLU690 expected in 4Q26, potentially boosting performance ~2.2x and sustaining technology leadership.
- P/E and P/S multiples are elevated in absolute terms, but we find them justified by superior growth profile, improving supply visibility, and strong positioning as a key domestic AI chip supplier.
Source: Refinitiv, Morgan Stanley Research
Risk Reward Themes
New Data Era:
Positive
Secular Growth:
Positive
Technology Diffusion:
Positive
View descriptions of Risk Rewards Themes here
BEAR CASE
20x 2026e P/S
We assume (1) <60% revenue CAGR in 2025-28 given slower-than-expected domestic AI capital expenditure and LLM commercialization progress; (2) market share loss in China's AI chip market, and failure to secure continuous mass orders from top-tier customers; and (3) gross margin falls below 40% in 2026 and 2027 due to fierce price competition, rising wafer fabrication costs and underutilized production capacity.
Rmb770.00
M
Risk Reward - Cambricon Technology Corporation (688256.SS)
KEY EARNINGS INPUTS
| Drivers | Dec 2025 | Dec 2026e | Dec 2027e | Dec 2028e |
|---|---|---|---|---|
| Gross Profit (YoY) (%) | 438 | 224.8 | 80.6 | 31.2 |
INVESTMENT DRIVERS
- CSP capex expansion
- Large model deployment growth
- Domestic substitution tailwind
- Product iteration (MLU roadmap)
- Software ecosystem improvement
- Policy support for AI chips
- New customer penetration
- Scaling of AI clusters
GLOBAL REVENUE EXPOSURE
Source: Morgan Stanley Research Estimate View explanation of regional hierarchies here
MS ALPHA MODELS
4/5 MOST
3 Month
Horizon
Source: Refinitiv, FactSet, Morgan Stanley Research; 1 is the highest favored Quintile and 5 is the least favored Quintile
RISKS TO PT/RATING
RISKS TO UPSIDE
- Stronger-than-expected AI demand
- CSP order ramp-up
- Accelerating localization
RISKS TO DOWNSIDE
- Capacity and yield constraints
- Customer concentration risk
- Slower technology iteration
OWNERSHIP POSITIONING
Inst. Owners, % Active
69.5%
Source: Refinitiv, Morgan Stanley Research
MS ESTIMATES VS. CONSENSUS
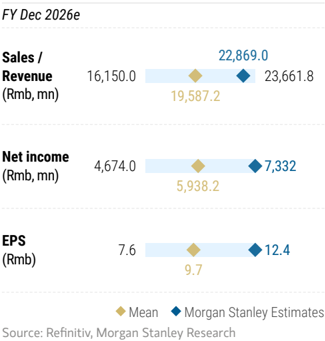
Income Statement
Rmb mn (Years End Dec)
Net sales
COGS
2028E
55,971.1
2026E
22,869.0
Cash Flow Statement
Rmb mn (Years End Dec)
Cashflow from Operations
2027E
42,274.2
2025
6,497.2
M
Net profits
Depreciation
Working Capital Change
Other adjustments
Cashflow from Investing
Cambricon: Financial Summary
Reported net Income
Adj. wtd.avg.shrs(m)
Reported EPS (Rmb)
EPS for consensus (Rmb)
Balance Sheet
Rmb mn (Years End Dec)
Cash
Mkt Securities
AR/NR
Inventory
Other
Current Assets
Long-term investments
Fixed assets
Other adjustments
Cashflow from financing
Increase in L/T debt
Increase in S/T debt
Cash Dividend Paid
Issuance of stock
Other adjustments
Exchange rate adjustment
Net change in cash
Financial Ratios
Growth(%)
Revenue
16,787.5
| 19.6 | 26.7 |
|---|---|
| 19.5 | 26.6 |
Intangible Assets
Other assets
Total Assets
S/T borrowings
PINI
Other ST liabilities
LT debt
Other LT liabilities
Total Liabilities
Common shares
Additional capital
Retained earning
Other shareholders' equity
Total Equity
Total Liab. & Shrhidr's Equity
E = Morgan Stanley Research Estimates
189.1
495.8
Operating profits
Pretax profits
Net profits
Margins (%)
2025
(498.5)
2,059.2
116.7
(3,126.6)
452.2
(4,142.0)
(142.8)
(53.1)
(3,501.0)
(445.1)
55.2
2026E
2,554.1
7,332.0
0.0
0.0
0.0
0.0
0.0
0.0
0.0
0.0
0.0
0.0
0.0
0.0
0.0
0.0
0.0
| 3,986.0 0.0 | 0.0 | 0.0 | 0.0 |
|---|---|---|---|
| (100.1) | 0.0 | 0.0 | 0.0 |
| 1,465.7 | 0.0 | 0.0 | 0.0 |
| 2,620.4 | 0.0 | 0.0 | 0.0 |
| (0.0) | 0.0 | 0.0 | 0.0 |
| (654.6) | |||
| 2025 | 2026E | 2027E | 2028E |
| 453.2 | 252.0 | 84.9 | 32.4 |
| NA | 300.1 | 82.7 | 36.9 |
| NA | 277.6 | 85.8 | 36.7 |
| NA | 256.1 | 67.5 | 36.7 |
| NA | 153.9 | 56.9 | 36.7 |
Gross Margin
Operating Margin
Pretax Margin
Net Profit
Return (%)
ROAE
ROAA
Gearing (%)
Net Debt/Equity
Liabilities/Equity
Ratios (X)
Current ratio
Quick ratio
Others
AR/NR Turnover (days)
Inventory Turnover (days)
AP Turnover (days)
Cash Conversion (days)
30.3
31.7
50.9
34.4
34.0
49.7
34.0
34.2
49.2
35.2
35.3
| 48.0 | 51.0 | 45.9 |
|---|---|---|
| 41.8 | 44.6 | 40.8 |
| (17.6) | (45.5) | (55.6) |
| 15.7 | 13.5 | 11.8 |
| 7.5 | 8.6 | 9.7 |
| 2.2 | 4.9 | 6.2 |
| 40.0 | 40.0 | 40.0 |
| 300.0 | 150.0 | 150.0 |
| 80.0 | 60.0 | 60.0 |
| 260.0 | 130.0 | 130.0 |
| 0.0 | 0.0 | 0.0 | 0.0 | EPS |
|---|---|---|---|---|
| 0.0 | 0.0 | 0.0 | 0.0 | |
| Source: Morgan Stanley Research, Company Data |
12,283.4
M
Iluvatar CoreX: Earnings estimate revisions
We raise our revenue forecasts 6% for 2026, 10% for 2027 and 8% for 2028: We
believe Iluvatar CoreX will be another company that is benefited by stronger demand for China AI accelerator. Given Iluvatar's order received from major CSP client in China, we expect to see robust revenue and earnings growth for the company. Besides, Iluvatar adopts TSMC as their foundry supplier and will produce fully-compliant chip according to BIS restrictions.
As Tiangai 300 (new products)'s ASP will be much higher than Tiangai 150, we also lift our gross margin assumptions to 52.4%, and 51.7% (from 51.3%, and 50.7%) in 2027 and 2028. Therefore, we increase our EPS estimates 13%, and 14% for 2027, and 2028.
Exhibit 14: Iluvatar: Earnings estimate revisions
| US$ mn | New '26 | Old'26E | Diff. | New '27 | Old'27E | Diff. | New '28 | Old'28E | Diff. |
|---|---|---|---|---|---|---|---|---|---|
| Net sales | 3,251 | 3,060 | 6% | 8,244 | 7,501 | 10% | 12,271 | 11,379 | 8% |
| Gross profit | 1,651 | 1,572 | 5% | 4,318 | 3,850 | 12% | 6,348 | 5,771 | 10% |
| Operating profit | (279) | (308) | -10% | 1,588 | 1,400 | 13% | 3,048 | 2,681 | 14% |
| Pretax Income | (232) | (262) | -11% | 1,637 | 1,449 | 13% | 3,096 | 2,729 | 13% |
| Net income | (232) | (262) | -11% | 1,637 | 1,449 | 13% | 2,920 | 2,570 | 14% |
| EPS for consensus | (0.91) | (1.03) | -11% | 6.44 | 5.70 | 13% | 11.48 | 10.10 | 14% |
| Margins | |||||||||
| Gross margin | 50.8% | 51.4% | 52.4% | 51.3% | 51.7% | 50.7% | |||
| Operating margin | -8.6% | -10.1% | 19.3% | 18.7% | 24.8% | 23.6% | |||
| Pretax margin | -7.1% | -8.6% | 19.9% | 19.3% | 25.2% | 24.0% | |||
| Net margin | -7.1% | -8.6% | 19.9% | 19.3% | 23.8% | 22.6% | |||
| Opex% | 59.4% | 61.4% | 33.1% | 32.7% | 26.9% | 27.2% |
Source: Morgan Stanley Research (e) estimates
Exhibit 15: Iluvatar: Half-year financials
| (Rmb mn) | 1H25 | 2H25 | 1H26E | 2H26E | 1H27E | 2H27E | 1H28E | 2H28E | 2025 | 2026E | 2027E | 2028E |
|---|---|---|---|---|---|---|---|---|---|---|---|---|
| Total revenues | 324.3 | 709.3 | 976.0 | 2,274.9 | 3,294.7 | 4,948.8 | 5,613.1 | 6,657.4 | 1,033.6 | 3,250.9 | 8,243.5 | 12,270.5 |
| H/H Change | -5.2% | 118.8% | 37.6% | 133.1% | 44.8% | 50.2% | 13.4% | 18.6% | ||||
| Y/Y Change | 64.2% | 107.4% | 201.0% | 220.7% | 237.6% | 117.5% | 70.4% | 34.5% | 91.6% | 214.5% | 153.6% | 48.9% |
| Cost of Sales | (161.8) | (313.8) | (496.4) | (1,103.3) | (1,576.6) | (2,348.8) | (2,711.3) | (3,211.5) | (475.6) | (1,599.7) | (3,925.4) | (5,922.7) |
| Percent of Revenues | 50% | 44% | 51% | 48% | 48% | 47% | 48% | 48% | 46% | 49% | 48% | 48% |
| Gross Profit | 162.4 | 395.6 | 479.5 | 1,171.6 | 1,718.1 | 2,600.0 | 2,901.8 | 3,445.9 | 558.0 | 1,651.2 | 4,318.2 | 6,347.8 |
| Gross Margin | 50.1% | 55.8% | 49.1% | 51.5% | 52.1% | 52.5% | 51.7% | 51.8% | 54.0% | 50.8% | 52.4% | 51.7% |
| Incremental Margin | 0.0% | 0.0% | 0.0% | 0.0% | 0.0% | 0.0% | 0.0% | 0.0% | 0.0% | 0.0% | 0.0% | 0.0% |
| Total Opex | (793.7) | (813.8) | (950.0) | (980.0) | (1,300.0) | (1,430.0) | (1,590.0) | (1,710.0) | (1,607.5) | (1,930.0) | (2,730.0) | (3,300.0) |
| Percent of Revenues | 244.8% | 114.7% | 97.3% | 43.1% | 39.5% | 28.9% | 28.3% | 25.7% | 155.5% | 59.4% | 33.1% | 26.9% |
| R&D | (451.5) | (522.7) | (580.0) | (600.0) | (750.0) | (780.0) | (820.0) | (840.0) | (974.2) | (1,180.0) | (1,530.0) | (1,660.0) |
| Percent of Revenues | 139.2% | 73.7% | 59.4% | 26.4% | 22.8% | 15.8% | 14.6% | 12.6% | 94.2% | 36.3% | 18.6% | 13.5% |
| General & Adm Exp. | (274.6) | (207.2) | (220.0) | (230.0) | (300.0) | (350.0) | (420.0) | (470.0) | (481.8) | (450.0) | (650.0) | (890.0) |
| Percent of Revenues | 84.7% | 29.2% | 22.5% | 10.1% | 9.1% | 7.1% | 7.5% | 7.1% | 46.6% | 13.8% | 7.9% | 7.3% |
| Selling Expenses | (67.6) | (83.9) | (150.0) | (150.0) | (250.0) | (300.0) | (350.0) | (400.0) | (151.6) | (300.0) | (550.0) | (750.0) |
| Percent of Revenues | 20.9% | 11.8% | 15.4% | 6.6% | 7.6% | 6.1% | 6.2% | 6.0% | 14.7% | 9.2% | 6.7% | 6.1% |
| Operating Income | (631.3) | (418.3) | (470.5) | 191.6 | 418.1 | 1,170.0 | 1,311.8 | 1,735.9 | (1,049.5) | (278.8) | 1,588.2 | 3,047.8 |
| Operating Margin | -194.7% | -59.0% | -48.2% | 8.4% | 12.7% | 23.6% | 23.4% | 26.1% | -101.5% | -8.6% | 19.3% | 24.8% |
| Total Non-operating Income (loss) | 21.9 | 23.9 | 23.5 | 23.0 | 25.6 | 23.7 | 23.9 | 24.0 | 45.9 | 46.5 | 49.3 | 48.0 |
| Profit Before Taxes | (609.3) | (394.3) | (446.9) | 214.6 | 443.7 | 1,193.7 | 1,335.8 | 1,760.0 | (1,003.7) | (232.4) | 1,637.4 | 3,095.8 |
| Percent of Revenues | -187.9% | -55.6% | -45.8% | 9.4% | 13.5% | 24.1% | 23.8% | 26.4% | -97.1% | -7.1% | 19.9% | 25.2% |
| Taxes | 0.0 | 0.0 | 0.0 | 0.0 | 0.0 | 0.0 | 0.0 | 176.0 | 0.0 | 0.0 | 0.0 | 176.0 |
| Tax Rate | 0.0% | 0.0% | 0.0% | 0.0% | 0.0% | 0.0% | 0.0% | 10.0% | 0.0% | 0.0% | 0.0% | 5.7% |
| Total Net Income to Parent | (609.3) | (394.3) | (446.9) | 214.6 | 443.7 | 1,193.7 | 1,335.8 | 1,584.0 | (1,003.7) | (232.4) | 1,637.4 | 2,919.8 |
| Percent of Revenues | -187.9% | -55.6% | -45.8% | 9.4% | 13.5% | 24.1% | 23.8% | 23.8% | -97.1% | -7.1% | 19.9% | 23.8% |
| EPS for consensus (Rmb) | (3.5) | (1.8) | (1.8) | 0.8 | 1.7 | 4.7 | 5.3 | 6.2 | (5.3) | (0.9) | 11.5 | |
| 6.4 |
Source: Company data, Morgan Stanley Research (e) estimates
M
Iluvatar: Valuation methodology, raising PT to HK$688
We continue to derive our price target (our base case scenario value) from a residual income model. The price target change reflects our EPS estimate revisions for 2026-28.
We remain our key valuation assumptions unchanged: cost of equity of 8.3% (beta of 1.05, risk-free rate of 2%, and risk premium of 6%), intermediate growth rate of 16%, and terminal growth rate of 6.0%.
Our bull and bear case scenario values also rise from Rmb1,100 and Rmb300 to Rmb1,261 and Rmb344, respectively, implying 2026e P/S of 87x and 24x.
Exhibit 16: Iluvatar: Residual income model
| Rmb million | 2026E | 2027E | 2028E | 2029E | 2030E | 2031E | 2032E | 2033E | 2034E | 2035E | 2036E | 2037E |
|---|---|---|---|---|---|---|---|---|---|---|---|---|
| Total Equity | 5,461 | 7,099 | 10,018 | 12,264 | 14,869 | 17,890 | 21,395 | 25,461 | 30,178 | 35,649 | 41,995 | 49,357 |
| Net Profit | (232) | 1,637 | 2,920 | 3,387 | 3,929 | 4,557 | 5,287 | 6,132 | 7,114 | 8,252 | 9,572 | 11,104 |
| ROAE | NM | 26.1% | 34.1% | 30.4% | 29.0% | 27.8% | 26.9% | 26.2% | 25.6% | 25.1% | 24.7% | 24.3% |
| Residual Income | 971 | 1,833 | 2,214 | 2,534 | 2,903 | 3,330 | 3,825 | 4,397 | 5,061 | 5,831 | 6,723 | |
| Spread | 17.8% | 25.8% | 22.1% | 20.7% | 19.5% | 18.6% | 17.9% | 17.3% | 16.8% | 16.4% | 16.0% | |
| Ending Equity Capital | 5,461 | |||||||||||
| PV of Forecast Period | 19,665 | |||||||||||
| PV of Continuing Value | 128,899 | |||||||||||
| Equity Value | 154,025 | |||||||||||
| No. of Shares | 254 | |||||||||||
| HKD/RMB | 0.88 | |||||||||||
| Price Target (HK$) | 688 |
Source: Company data, Morgan Stanley Research (e) estimates
Exhibit 17: Iluvatar: One-year forward P/S trend
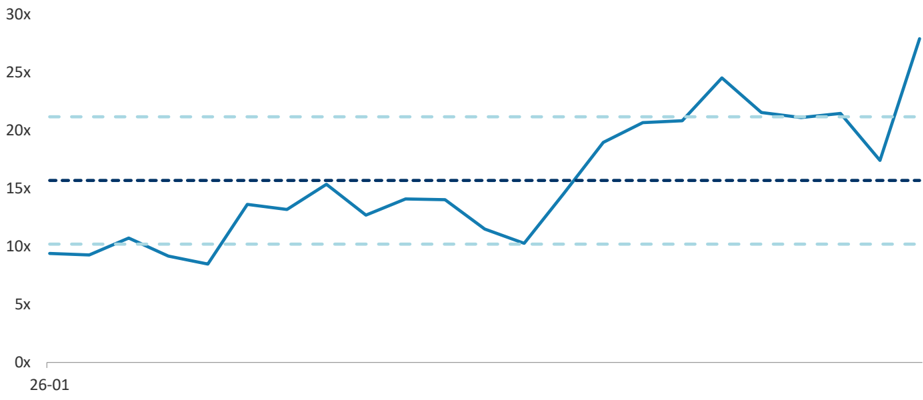
Iluvatar one-year forward P/S
Source: Company data, FactSet, Morgan Stanley Research
M
Risk Reward - Iluvatar CoreX Semiconductor Co., Ltd. Risk Reward - Iluvatar CoreX Semiconductor Co., Ltd. (9903.HK)
(9903.HK) Leveraging supply chain resilience with strong order visibility
HK$688.00 PRICE TARGET
Key valuation assumptions include:
- An 8.3% cost of equity (derived from a beta of 1.05, risk-free rate of 2.0%, and equity risk premium of 6.0%)
- A long-term payout ratio of 34% (was 33%)
- A medium-term growth rate of 16%
- A perpetual terminal growth rate of 6%
RISK REWARD CHART
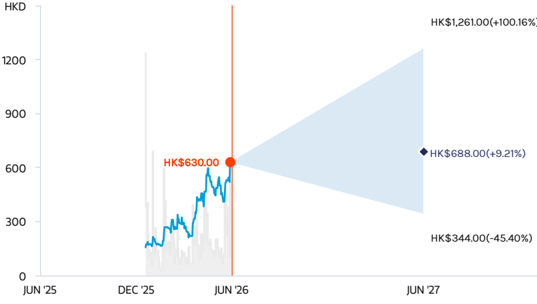
Key:
- Historical Stock Performance
- Current Stock Price
Source: Refinitiv, Morgan Stanley Research
BULL CASE
87x 2026e P/S
We assume: 1) >150% revenue CAGR in 2025-28e driven by a more aggressive domestic AI infrastructure build-out and large-scale procurement of both training and inference chips from Chinese cloud service providers and state-owned enterprises. 2) Gross margin improves to over 60% in 2026e and 2027e thanks to production scale effects, mature technology iteration and optimized high-value product structure. 3) The company achieves full-year profitability in 2026, ahead of our base case.
HK$1,261.00
Price Target
BASE CASE
47x 2026e P/S
We assume: 128% revenue CAGR in 202528e given strong orders from CSP clients and solid supply chain capacity. 2) Gross margin at 50.8% in 2026e and 52.4% 2027e due to better product mix. 3) The company achieve full-year profitability in 2027.
HK$688.00
OVERWEIGHT THESIS
- Strong order visibility from domestic CSPs, with TianGai-150 shipments ramping in 2H26 and contributing >Rmb4bn revenue over 2026-27.
- Diversified foundry strategy ensures supply security, with access to TSMC capacity mitigating risks from export controls and domestic yield constraints.
- High CUDA compatibility enables lowfriction migration, with successful LLM deployment validating product-market fit.
- Clear path to profitability, with breakeven expected in 2026 and full-year profitability in 2027 driven by operating leverage and scaling.
- Our price target implies 47x 2026e P/S, which is lower than the peer average of 75x 2026e P/S.
Risk Reward Themes
New Data Era:
Positive Positive
Technology Diffusion:
View descriptions of Risk Rewards Themes here
BEAR CASE
24x 2026e P/S
We assume: <80% revenue CAGR in 202528e given slower-than-expected domestic AI capital expenditure and large model commercialization progress. 2) Nvidia relaxes export restrictions on mid-range AI chips to China, leading to intensified price competition. 3) Gross margin falls below 45% in 2026e and 2027e due to fierce price competition. 4) The company does not achieve full-year profitability until 2028.
HK$344.00
M
Risk Reward - Iluvatar CoreX Semiconductor Co., Ltd. (9903.HK)
KEY EARNINGS INPUTS
| Drivers | Dec 2025 | Dec 2026e | Dec 2027e | Dec 2028e |
|---|---|---|---|---|
| Operating profit (YoY) (%) | 18.3 | (73.4) | (669.6) | 91.9 |
INVESTMENT DRIVERS
- CSP AI capex growth
- TianGai shipment ramp
- CUDA migration trend
- Supply chain advantage (TSMC)
- AI inference expansion
- Policy support
- Customer base expansion
- Margin improvement trajectory
GLOBAL REVENUE EXPOSURE
Source: Morgan Stanley Research Estimate View explanation of regional hierarchies here
RISKS TO PT/RATING
RISKS TO UPSIDE
- Stronger-than-expected CSP orders
- Faster CUDA replacement with Iluvatar's software
- Expansion of overseas and domestic capacity
RISKS TO DOWNSIDE
- Order ramp below expectations
- Escalation of sanctions
- Intensifying competition
OWNERSHIP POSITIONING
Inst. Owners, % Active
99.9%
Source: Refinitiv, Morgan Stanley Research
MS ESTIMATES VS. CONSENSUS
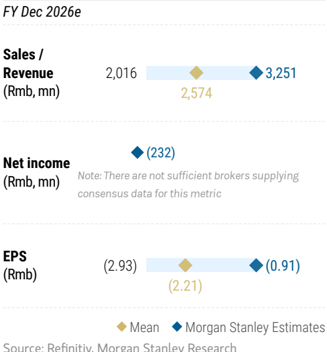
Income Statement
Rmb mn (Years End Dec)
Net sales
COGS
2025
1,033.6
2026E
3,250.9
2028E
12,270.5
2027E
8,243.5
M
Pre-tax income
1,637.4
(1,003.7)
(232.4)
3,095.8
Iluvatar: Financial Summary
Adj.wtd.avg.shrs( m)
Reported EPS (Rmb)
EPS for consensus (Rmb)
Balance Sheet
Rmb mn (Years End Dec)
Cash
Mkt Securities
AR/NR
Inventory
Other
Current Assets
Long-term investments
Fixed assets
Intangible Assets
| (5.3) (5.3) | (0.9) (0.9) | 6.4 6.4 | 11.5 11.5 |
|---|---|---|---|
| 1,3025 0.0 | 0.0 | 0.0 | |
| 0.0 | |||
| 187.7 |
Other assets
Total Assets
S/T borrowings
AP/NP
Other ST liabilities
LT debt
Other LT liabilities
Total Liabilities
Common shares
Additional capital
Retained earning
Other shareholders' equity
Total Equity
Total Liab. & Shrhidr's Equity
E = Morgan Stanley Research Estimates
Source: Morgan Stanley Research, Company Data
189.0
189.8
25.5
3,912.0
| 254.3 | |
|---|---|
| 3,315.0 | |
| 1,929.8 | 3,567.2 |
| (37.9) | (37.9) |
| 5,461.2 | 7,098.6 |
| 7,211.2 | 9,334.4 |
254.3
254.3
254.3
7007080001-900910
Cash Flow Statement
Rmb mn (Years End Dec)
Cashflow from Operations
Net profits
Depreciation
Working Capital Change
Other adjustments
Cashflow from Investing
Change of LT Investment
Change of ST Investment
Other adjustments
Cashflow from financing
Increase in U/T debt
Increase in S/T debt
Cash Dividend Paid
Issuance of stock
Other adjustments
Exchange rate adjustment
Net change in cash
Financial Ratios
Growth(%)
Revenue
Operating profits
Pretax profits
Net profits
EPS
Margins (%)
Gross Margin
2025
(1,161.6)
(1,003.7)
97.0
(823.6)
568.8
(132.3)
(59.7)
(49.1)
0.1
(23.6)
2,490.9
| 323.4 | 0.0 0.0 | 0.0 0.0 | 0.0 0.0 |
|---|---|---|---|
| 77.6 0.0 | 0.0 | 0.0 | 0.0 |
| 38.0 | 0.0 | 0.0 | |
| 2,051.9 | 0.0 | 0.0 | 0.0 |
| (5.9) | 0.0 | 0.0 | 0.0 |
| 1,197.1 | |||
| 2026E | 2027E | 2028E | |
| 2025 | |||
| 91.6 | 214.5 | 153.6 | 48.9 |
| 18.3 | (73.4) | NA | 91.9 |
| 12.5 | (76.8) | NA | 89.1 |
| 12.5 | (76.8) | NA | 78.3 |
| (2.6) | (82.8) | NA | 78.3 |
| 54.0 | 50.8 | 52.4 |
Operating Margin
Pretax Margin
Net Profit
Return (%)
ROAE
ROAA
Gearing (%)
Net Debt/Equity
Liabilities/Equity
Ratios (X)
Current ratio
Quick ratio
Others
AR/NR Turnover (days)
Inventory Turnover (days)
AP Turnover (days)
Cash Conversion (days)
(97.1)
(8.6)
(7.1)
(7.1)
P191888933833331
0.0
0.0
0.0
19.3
19.9
19.9
a see sessina
0.0
0.0
0.0
51.7
24.8
25.2
23.8
| (5.9) | 26.1 | 34.1 |
|---|---|---|
| (4.2) | 19.8 | 26.8 |
| (27.5) | 2.8 | (10.0) |
| 32.0 | 31.5 | 24.0 |
| 5.0 | 4.7 | 5.8 |
| 2.6 | 1 | 1.7 |
| 160.0 | 140 | 120.0 |
| 400.0 | 320 | 250.0 |
| 10.0 | 10 | 10.0 |
| 550.0 | 450 | 360.0 |
(101.5)
(97.1)
0.7
0.0
M
Related Research Reports
Industry:
- China's Industrial Evolution: Global Semis - How China Will Chip In (Mar 2019)
- Disruption Decoded: How China Is Rewiring Global Semis (Jun 2020)
Segment:
AI GPU Semis:
- China's AI Accelerators - Who's Poised to Win? (Apr 2026)
- China's Emerging Frontiers: China AI GPUs - Closing the Gap with the US (Mar 2026)
- China's Localization: Exploring the niche in ASICs (Apr 2023)
- China's Localization: How will China chip in? Developing CPU and AI semi designs for the local market (Nov 2019)
Analog:
- China's Localization: Analog IC: Identifying the long-term beneficiaries (Sept 2022)
Cloud Semis:
- Global Semiconductors: How will China chip in? Seizing cloud semi strength in China (Mar 2020)
EDA & IP
- Empyrean Technology: EDA: Local semis' core enabler (Jun 2023)
- M31 Technology: Building the IP foundations of China's semi localization (Jun 2023)
Foundry:
- SMIC: Key foundry for China's semi localization, but advanced nodes ROI the main challenge (Aug 2020)
- Hua Hong Semiconductor Ltd: Powering China's Specialty Semi Localization (Aug 2020)
Backend:
- Jiangsu Changjiang Electronics TechSlow recovery with share loss (Sept 2024)
FPGA:
- China's Localization: How China Will Chip In; Exploring FPGA Localization Opportunities (Jul, 2022)
M
MCU:
- China's Localization: How Will China Chip In? Exploring MCU Localization Opportunities (Jul, 2021)
Power Semis , Silicon Carbide & Gallium Nitride:
- China's Localization: The driving force behind power semis (April 2021)
- China's Localization: How China will chip in; rising power in discrete world (Oct 2021)
- China's Localization: The Driving Force Behind Silicon Carbide (Jun 2023)
- Semiconductors: Three investment themes in China auto semi localization (Jun 2025)
- Innoscience: Riding the GaN secular growth wave; initiate at EW (Oct 2025)
RF Semis:
- China's Localization: RF semis: A major untapped market in the China smartphone supply chain (Jun 2020)
Semi equipment:
- Greater China Semiconductors: How will China chip in? Chinese memory fabs to yield soon (Jan 2020)
- NAURA Technology Group Co Ltd: China semi localization enabler facing near-term turbulence (Nov 2022)
M
Morgan Stanley Securities (China) Co., Ltd. is engaged by ASMPT Limited ('ASMPT') in relation to certain matters. Morgan Stanley Securities (China) Co., Ltd. may receive fees as a result of the engagement. Please refer to the notes at the end of this report.
This report references U.S. Executive Order 14032 and/or entities or securities that are designated thereunder. U.S. persons may be prohibited from buying certain securities of entities named in this report. Readers are solely responsible for ensuring that their investment activities are carried out in compliance with applicable laws.
This report references export controls and/or entities that may be subject to export control restrictions. Readers are solely responsible for ensuring that their investment or trade activities are carried out in compliance with applicable laws.
M
Risk Reward Reference links
-
View explanation of Options Probabilities methodology -
-
Options_Probabilities_Exhibit_Link.pdf
- View descriptions of Risk Rewards Themes - RR_Themes_Exhibit_Link.pdf
- View explanation of regional hierarchies - GEG_Exhibit_Link.pdf
- View explanation of Theme/Exposure methodology -ESG_Sustainable_Solutions_External_Link.pdf
- View explanation of HERS methodology - ESG_HERS_External_Link.pdf
M
Disclosure Section
The information and opinions in Morgan Stanley Research were prepared or are disseminated by Morgan Stanley Asia Limited (which accepts the responsibility for its contents) and/or Morgan Stanley Asia (Singapore) Pte. (Registration number 199206298Z) and/or Morgan Stanley Asia (Singapore) Securities Pte Ltd (Registration number 200008434H), regulated by the Monetary Authority of Singapore (which accepts legal responsibility for its contents and should be contacted with respect to any matters arising from, or in connection with, Morgan Stanley Research), and/or Morgan Stanley Taiwan Limited and/or Morgan Stanley & Co International plc, Seoul Branch, and/or Morgan Stanley Australia Limited (A.B.N. 67 003 734 576, holder of Australian financial services license No. 233742, which accepts responsibility for its contents), and/or Morgan Stanley Wealth Management Australia Pty Ltd (A.B.N. 19 009 145 555, holder of Australian financial services license No. 240813, which accepts responsibility for its contents), and/or Morgan Stanley India Company Private Limited having Corporate Identification No (CIN) U22990MH1998PTC115305, regulated by the Securities and Exchange Board of India ('SEBI') and holder of licenses as a Research Analyst (SEBI Registration No. INH000001105); Stock Broker (SEBI Stock Broker Registration No. INZ000244438), Merchant Banker (SEBI Registration No. INM000011203), and depository participant with National Securities Depository Limited (SEBI Registration No. IN-DP-NSDL-567-2021) having registered office at Altimus, Level 39 & 40, Pandurang Budhkar Marg, Worli, Mumbai 400018, India; Telephone no. +91-22-61181000; Compliance Officer Details: Mr. Tejarshi Hardas, Tel. No.: +91-22-61181000 or Email: tejarshi.hardas@morganstanley.com; Grievance officer details: Mr. Tejarshi Hardas, Tel. No.: +91-22-61181000 or Email: msic-compliance@morganstanley.com which accepts the responsibility for its contents and should be contacted with respect to any matters arising from, or in connection with, Morgan Stanley Research, and their affiliates (collectively, "Morgan Stanley"). Morgan Stanley India Company Private Limited (MSICPL) may use AI tools in providing research services. All recommendations contained herein are made by the duly qualified research analysts.
For important disclosures, stock price charts and equity rating histories regarding companies that are the subject of this report, please see the Morgan Stanley Research Disclosure Website at www.morganstanley.com/eqr/disclosures/webapp/generalresearch, or contact your investment representative or Morgan Stanley Research at 1585 Broadway, (Attention: Research Management), New York, NY, 10036 USA.
For valuation methodology and risks associated with any recommendation, rating or price target referenced in this research report, please contact the Client Support Team as follows: US/Canada +1 800 303-2495; Hong Kong +852 2848-5999; Latin America +1 718 754-5444 (U.S.); London +44 (0)20-7425-8169; Singapore +65 6834-6860; Sydney +61 (0)2-9770-1505; Tokyo +81 (0)3-6836-9000. Alternatively you may contact your investment representative or Morgan Stanley Research at 1585 Broadway, (Attention: Research Management), New York, NY 10036 USA.
圖片清單(已驗證 2026-07-02)
回補驗證:僅涵蓋已被 lib 頁嵌入的圖片,非全量驗證。
| 檔名 | size | 分類 | 親眼所見內容 |
|---|---|---|---|
260622_中國__GPU _TAMms_china-AI-GPU-TAM_002.png |
27KB | 真資料圖 | 疊加長條圖,依 China CSP/Telecom operator/Sovereign & SOEs/Others/Overseas capex 分項,2023-2030E,單位 (US$ bn) |
260622_中國__GPU _TAMms_china-AI-GPU-TAM_003.png |
36KB | 真資料圖 | 折線圖「China AI chip self-sufficiency」,2021-2030E,各年標註百分比數值方框(如10%、20%…70%) |