PDF 原檔:260605_3008_大立光_ms_largan_original.pdf
原始內容
M June 5, 2026 01:40 PM GMT
Largan Precision | Asia Pacific
May Revenue Up 43% YoY but Down 14% MoM
In this report, we focus on Largan's monthly sales, which we believe could be a catalyst for its share price.
Details:
- May revenue was NT$4,593mn, up 43% YoY but down 14% MoM. 5M26 revenue was up 15% YoY.
- The company expects June shipments to decline MoM, mainly owing to customer scheduling adjustments, despite relatively stable underlying demand.
Our view:
- We believe Android smartphone shipments will face headwinds in 2026, which could constrain lens demand.
- The stock has re-rated significantly in recent weeks, mainly based on positive CPO sentiment. However, after recognizing the challenges of scalable production (high precision + huge workforce requirement), we believe sentiment will calm down.
- P/E is currently 24x for 2026e, at the high end of its valuation range of 1325x over the past 12 months.
Exhibit 1 : Largan - monthly revenue YoY growth rate vs. share price
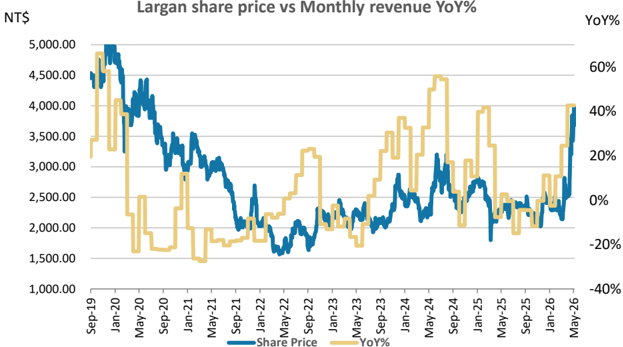
ShareMPrice
YoYp
Source: Refinitiv, FactSet, company data, Morgan Stanley Research. Note: Past performance is no guarantee of future results. Results shown do not include transaction costs.
Morgan Stanley Asia Limited+
Andy Meng, CFA
Equity Analyst
Andy.Meng@morganstanley.com
+852 2239-7689
Betty Chen
Research Associate
Betty.H.Chen@morganstanley.com
+852 2239-7213
Morgan Stanley Taiwan Limited+
Sharon Shih
Equity Analyst
Sharon.Shih@morganstanley.com
+886 2 2730-2865

Largan Precision (3008.TW, 3008 TT)
Greater China Technology Hardware | Taiwan
| Stock Rating | Equal-weight | Equal-weight | ||
|---|---|---|---|---|
| Industry View | In-Line | |||
| Price target | NT$2,450.00 | |||
| Up/downside to price target (%) | Up/downside to price target (%) | (33) | ||
| Shr price, close (Jun 5, 2026) | Shr price, close (Jun 5, 2026) | NT$3,680.00 | ||
| 52-Week Range | NT$4,225.00- | |||
| 2,020.00 | ||||
| Sh out, dil, curr (mn) | 134 | |||
| Mkt cap, curr (mn) | NT$493,636 | |||
| EV, curr (mn) | (mn) | NT$362,427 NT$2,230 | ||
| Fiscal Year Ending EPS (NT$)** | 12/25 159.40 | 12/26e | 12/27e | 12/28e |
| Prior EPS (NT$)** | - | 153.49 - | 165.87 - | 165.88 - |
| Revenue, net (NT$ mn) | 61,148 | 60,205 | 63,873 | 65,651 |
| EBITDA (NT$ mn) | 31,260 | 30,098 | 32,983 | 33,784 |
| ModelWare net inc (NT | 21,275 | 20,486 | 22,139 | 22,140 |
| $ mn) | 24.0 | 22.2 | ||
| P/E | 1.7 | |||
| 15.7 | 22.2 | 1.9 | ||
| P/BV | 2.3 | 2.1 | ||
| ROE (%) | 11.5 | 10.7 | 10.5 | 9.5 |
Unless otherwise noted, all metrics are based on Morgan Stanley ModelWare framework
** = Based on consensus methodology
e = Morgan Stanley Research estimates
Morgan Stanley does and seeks to do business with companies covered in Morgan Stanley Research. As a result, investors should be aware that the firm may have a conflict of interest that could affect the objectivity of Morgan Stanley Research. Investors should consider Morgan Stanley Research as only a single factor in making their investment decision.
圖片清單(已驗證 2026-07-02)
回補驗證:僅涵蓋已被 lib 頁嵌入的圖片,非全量驗證。
| 檔名 | size | 分類 | 親眼所見內容 |
|---|---|---|---|
260605_3008_大立光_ms_largan_001.png |
81948 bytes | 真資料圖 | 標題「Largan share price vs Monthly revenue YoY%」,雙軸圖:左軸NT$股價(藍線)、右軸YoY%月營收成長率(黃線),時間軸Sep-19~May-26 |
260605_3008_大立光_ms_largan_002.png |
66625 bytes | 裝飾·logo·banner | 廣告banner,文字「Asia Summer School 2026」,藍色水面背景圖搭配書本圖示與箭頭按鈕圖示,與報告內容無關 |