PDF 原檔:報告_UBS_研華2395_20260717_original.pdf
圖片清單(已驗證 2026-07-20)
| 檔名 | size | 分類 | 親眼所見內容 |
|---|---|---|---|
260717_ubs_advantech_001.png |
43KB | 真資料圖 | 股價情境圖:現價 TWD 530(16-Jul)向上/向下輻射帶,Upside NT$765(+44%)/Base NT$628/Downside NT$439(-17%),12 個月展望 |
260717_ubs_advantech_002.png |
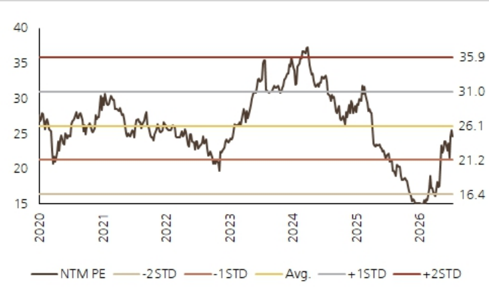
57KB | 真資料圖 | NTM PE 帶狀圖,2020–2026,含 -2SD/-1SD/Avg/+1SD/+2SD 五條參考線與對應數值(16.4/21.2/26.1/31.0/35.9) |
260717_ubs_advantech_003.png |
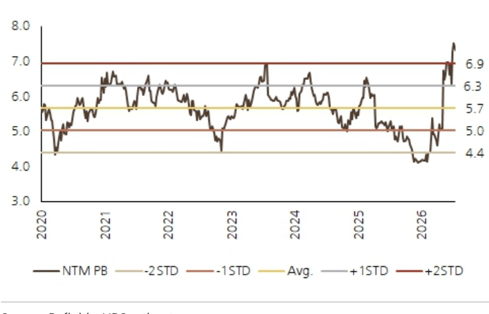
59KB | 真資料圖 | NTM PB 帶狀圖,2020–2026,含 -2SD/-1SD/Avg/+1SD/+2SD 五條參考線(4.4/5.0/5.7/6.3/6.9) |
260717_ubs_advantech_004.png |
88KB | 真資料圖 | 股價 vs 目標價階梯圖(2023-04–2026-07),下方彩帶標示評等區間(No Rating → Buy),最新目標價階梯上調至圖右側高點 |
原始內容
Advantech Durable growth takes hold
Q226 revenue beat, expect strong earnings results
Advantech reported much stronger-than-expected Q226 revenue, which we think should lead to a strong earnings beat for the quarter. Besides, OPM could beat expectation, driven by successful pass-through of higher input costs to customers and positive operating leverage. At the upcoming analyst meeting on August 5, we expect management to talk positively about its project design-wins although book-to-billings (BB) ratio is unlikely to reach another record high as Advantech accelerated deliveries through worker overtime and improved memory sourcing. We raise our 2026/27E earnings growth estimates to 55%/23% YoY and lift our price target to NT$628 from NT$522. Our 2026/27E estimates are 22-29% above consensus. Buy maintained.
Sustained strong order momentum
Advantech reported Q226 revenue growth of 46.5%, beating UBS/consensus estimates by 24%/21%. We attribute the strong performance to a combination of 10-15% price increases (mainly reflecting higher memory costs), sufficient supply of key components (mainly memory), and strong order momentum. Advantech has increased production through overtime operations in Taiwan and mainland China, capacity expansion in Japan, and increased outsourcing to factories in Malaysia. We think Advantech's BB ratio could decline QoQ in Q226 (vs high at 1.77 at end Q126) considering the strong deliveries in the quarter. However, we do not view this negatively. Instead, we would focus more on project design-win momentum, which serves as a key leading indicator of order backlog over the next six months. We expect semi equipment, medical, and factory automation (robots, cobots) to sustain strong order momentum in H226/2027.
Expect higher OPM on positive operating leverage
We expect Advantech's gross margin to remain broadly stable as it has been able to largely pass higher memory costs on to customers. Looking into H226, cost pressure could broaden beyond memory to include CPU and PCB. However, given the current strength of demand, we believe Advantech could pass through most of these additional costs. For opex, Advantech has historically maintained R&D at 8% of total sales while strictly controlling other expenses. Therefore, given the strong Q2 revenue beat, we think operating margin could expand more than previously expected.
Valuation: price target raised to NT$628.00; reiterate Buy
We raise our 2026-28E earnings by 19-21%, mainly to reflect stronger sales momentum and positive operating leverage. Our PT is lifted to NT$628 from NT$522, based on 27x 2027E PE (unchanged). Advantech's valuation looks attractive at 23x 2027PE, below the average since 2020, while we estimate a 2026-28E earnings CAGR of 32% (+1.6 SD above average). We expect the upcoming analyst meeting and consensus upward revisions to earnings to serve as positive share price catalysts.
| Highlights (NT$m) | 12/23 | 12/24 | 12/25 | 12/26E | 12/27E | 12/28E | 12/29E | 12/30E |
|---|---|---|---|---|---|---|---|---|
| Revenues | 64,568 | 59,786 | 70,882 | 101,482 | 122,794 | 138,990 | 151,290 | 162,715 |
| EBIT (UBS) | 12,128 | 9,050 | 11,567 | 19,191 | 24,054 | 29,015 | 31,619 | 34,030 |
| Net earnings (UBS) | 10,838 | 9,005 | 10,593 | 16,433 | 20,269 | 24,298 | 26,456 | 28,441 |
| EPS (UBS, diluted) (NT$) | 12.65 | 10.38 | 12.14 | 18.85 | 23.25 | 27.88 | 30.35 | 32.63 |
| DPS (net) (NT$) | 9.99 | 9.45 | 8.39 | 11.20 | 17.34 | 21.39 | 25.64 | 27.91 |
| Net (debt) / cash | 10,655 | 13,345 | 11,090 | 9,409 | 9,525 | 11,286 | 12,187 | 13,232 |
| Profitability/valuation | 12/23 | 12/24 | 12/25 | 12/26E | 12/27E | 12/28E | 12/29E | 12/30E |
| EBIT (UBS) margin% | 18.8 | 15.1 | 16.3 | 18.9 | 19.6 | 20.9 | 20.9 | 20.9 |
| ROIC (EBIT)% | 39.1 | 27.1 | 32.0 | 44.8 | 48.8 | 54.2 | 55.6 | 56.9 |
| EV/EBITDA (UBS core) x | 21.4 | 28.4 | 21.5 | 21.7 | 17.4 | 14.5 | 13.2 | 12.3 |
| P/E (UBS, diluted) x | 27.5 | 34.2 | 27.9 | 28.1 | 22.8 | 19.0 | 17.5 | 16.2 |
| Equity FCF (UBS) yield% | 2.8 | 3.0 | 2.4 | 1.7 | 3.3 | 4.4 | 5.1 | 5.5 |
| Dividend yield (net)% | 2.9 | 2.7 | 2.5 | 2.1 | 3.3 | 4.0 | 4.8 | 5.3 |
Source: Company accounts, LSEG Eikon, UBS estimates. Metrics marked as (UBS) have had analyst adjustments applied. Valuations: based on an average share price that year, (E): based on a share price of NT$ 530.00 on 16-Jul-2026
| Equities | Equities | Equities | Equities |
|---|---|---|---|
| Taiwan | Taiwan | Taiwan | Taiwan |
| Electric Components & Equipment | Electric Components & Equipment | Electric Components & Equipment | Electric Components & Equipment |
| 12-month rating | 12-month rating | 12-month rating | Buy |
| 12m price target | 12m price target | 12m price target | NT$628.00 Prior : NT$522.00 |
| Price (16 Jul 2026) | Price (16 Jul 2026) | Price (16 Jul 2026) | NT$530.00 |
| RIC: 2395.TW BBG: 2395 TT | RIC: 2395.TW BBG: 2395 TT | RIC: 2395.TW BBG: 2395 TT | RIC: 2395.TW BBG: 2395 TT |
| Trading data and key metrics | Trading data and key metrics | Trading data and key metrics | Trading data and key metrics |
| 52-wk range | 52-wk range | 52-wk range | NT$546.00-273.50 |
| Market cap. | Market cap. | Market cap. | NT$457b/US$14.2b |
| Shares o/s | Shares o/s | Shares o/s | 863m (ORD) |
| Free float | Free float | Free float | 53% |
| Avg. daily volume ('000) | Avg. daily volume ('000) | Avg. daily volume ('000) | 4,145 |
| Avg. daily value (m) | Avg. daily value (m) | Avg. daily value (m) | NT$1,930.9 |
| Common s/h equity (12/26E) | Common s/h equity (12/26E) | Common s/h equity (12/26E) | NT$61.7b |
| P/BV (12/26E) | P/BV (12/26E) | P/BV (12/26E) | 7.4x |
| Net debt to EBITDA (12/26E) | Net debt to EBITDA (12/26E) | Net debt to EBITDA (12/26E) | NM |
| EPS (UBS, diluted) (NT$) | EPS (UBS, diluted) (NT$) | EPS (UBS, diluted) (NT$) | EPS (UBS, diluted) (NT$) |
| From | To | %ch Cons. | |
| 12/26E | 15.78 | 18.85 | 19 15.56 |
| 12/27E | 19.34 | 23.25 | 20 18.15 |
| 12/28E | 23.13 | 27.88 | 21 20.60 |
| Ally Chen Analyst | |||
| ally.chen@ubs.com +886-2-8722 7347 | |||
| Megan Li Analyst megan.li@ubs.com |
Advantech - 2395.TW Price
700
Thesis Map UBS Research THESIS MAP a guide to our thinking and what´s where in this report
500
Pivotal Questions
300
2024
UBS VIEW
EVIDENCE
WHAT´S PRICED IN?
Upside/Downside Spectrum
Company Description
2025
TWD 530.0
16 Jul
765.0
Upside to Downside
2.6 to 1
Upside:
+44%
Q: How can AI technologies accelerate investment into automation?
We think automation investment growth could accelerate as AI technology advances control systems and agentic AI transforms automation into autonomous manufacturing, further improving production efficiency. Moreover, edge-AI is expanding automation applications beyond factories and into industries requiring high levels of data privacy.
Q: Which supply chain subsectors benefit from higher automation investment?
Market research agencies forecast the smart manufacturing (software & hardware) and robot industries to see sales growth of 14-20% during 2025-32F, notably faster than industrial machinery at 7-9%. Among smart manufacturing, these market forecasters expect all three segments (software, hardware and services) to maintain a 15% sales CAGR during 2025-32F, with hardware slightly accelerating from a 14% sales CAGR during 2022-24.
Q: How fast will humanoid robots scale up?
We estimate humanoid robots (link, link) to ramp up to a global population of more than 2m by 2035E and more than 300m by 2050E, implying TAM of US$30-40bn in 2035E and US$1.4-1.7trn by 2050E, for an ecosystem spanning components and OEMs, software and data, production and services.
We think Advantech looks well positioned to benefit from: 1) accelerating investment in automation as a hardware supplier for multinational industrial automation providers, 2) dedicated teams to provide customised automation solutions, and 3) the expansion into AI-powered projects. We forecast Advantech's earnings growth to accelerate via strong order intake and margin expansion from improving sales mix and scale benefits.
Sales BB ratio continues to expand sequentially, up from 1.33 in Q425 to 1.77 in Q126, showcasing robust bookings. The latest order backlog data in May is higher at more than NT$1.30bn, versus NT $1.13bn in March. Design-win project value increased by 2.3x in Q126, compared with Q425. These project wins could turn into order backlog in around six months' time. Advantech also registered accelerated sales growth of 46.5% in Q226, up from 17.5% in Q126, showing strong order momentum and project delivery.
Advantech is now trading at 23x 2027E PE, below the average since 2020, while we estimate its 2026-28E earnings CAGR at 32%, +1.6 SD above the average since 2020. We expect sustainable top-line growth to further support earnings growth. We view the August 5 analyst meeting and consensus earnings upward revisions as potential positive share price catalysts.
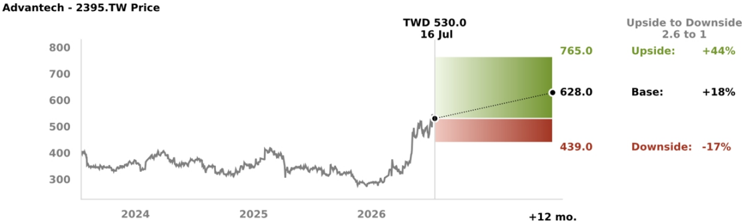
| Value drivers (2027E) | Edge-AI sales growth | Non-edge-AI sales growth | Gross margin | Operating margin | Earnings growth |
|---|---|---|---|---|---|
| NT$765 upside | 50.0% | 13.0% | 40.0% | 20.5% | 30.9% |
| NT$628 base | 45.0% | 13.0% | 39.2% | 19.6% | 23.3% |
| NT$439 downside | 30.0% | 6.0% | 38.0% | 17.0% | 5.9% |
Source: UBS estimates
Established in 1981 and listed on the Taiex in 1999, Advantech is a world-leading Taiwanese IPC (industrial PC) supplier. Its product offerings involve embedded boards and chassis, industrial computers and controls, and after-sales services with applications spanning manufacturing automation, healthcare, transportation, energy and networking industries. To serve global markets, it has three manufacturing sites in Taiwan, Japan and China and direct subsidiaries in 27 countries.
40
35
30
25
20
15
35.9
31.0
26.1
8.0
7.0
6.0
5.0
Figure 1: Summary of changes to our earnings estimates
| 2026E | 2026E | 2026E | 2027E | 2027E | 2027E | 2028E | 2028E | 2028E | |
|---|---|---|---|---|---|---|---|---|---|
| (NT$mn) | New | Old | Chg (%) | New | Old | Chg (%) | New | Old | Chg (%) |
| Sales | 101,482 | 83,605 | 21 | 122,794 | 97,922 | 25 | 138,990 | 111,974 | 24 |
| Gross Profit | 39,608 | 33,120 | 20 | 48,135 | 39,169 | 23 | 55,596 | 44,790 | 24 |
| Operating Profit | 19,191 | 15,663 | 23 | 24,054 | 19,568 | 23 | 29,015 | 23,585 | 23 |
| Pre-tax Income | 20,165 | 16,636 | 21 | 24,916 | 20,458 | 22 | 29,887 | 24,498 | 22 |
| Net Income | 16,433 | 13,752 | 19 | 20,269 | 16,857 | 20 | 24,298 | 20,162 | 21 |
| Basic EPS (NT$) | 18.97 | 15.87 | 19 | 23.40 | 19.46 | 20 | 28.05 | 23.27 | 21 |
| Diluted EPS (NT$) | 18.85 | 15.78 | 19 | 23.25 | 19.34 | 20 | 27.88 | 23.13 | 21 |
| Operating Ratios (%) | New | Old | Chg (ppt) | New | Old | Chg (ppt) | New | Old | Chg (ppt) |
| Gross Margin | 39.0 | 39.6 | -0.6 | 39.2 | 40.0 | -0.8 | 40.0 | 40.0 | 0.0 |
| Operating Margin | 18.9 | 18.7 | 0.2 | 19.6 | 20.0 | -0.4 | 20.9 | 21.1 | -0.2 |
| Pre-tax Margin | 19.9 | 19.9 | 0.0 | 20.3 | 20.9 | -0.6 | 21.5 | 21.9 | -0.4 |
| Net Margin | 16.2 | 16.4 | -0.3 | 16.5 | 17.2 | -0.7 | 17.5 | 18.0 | -0.5 |
Source: UBS estimates
Figure 2: UBS vs. consensus estimates
| (NT$m) | UBS Consensus Diff (%) 2026E | UBS Consensus Diff (%) 2026E | UBS Consensus Diff (%) 2026E | UBS Consensus 2027E | UBS Consensus 2027E | UBS Consensus 2027E | Diff (%) | UBS Consensus 2028E | UBS Consensus 2028E | Diff (%) |
|---|---|---|---|---|---|---|---|---|---|---|
| Sales | 101,482 | 85,699 | 18 | 122,794 | 96,923 | 27 | 138,990 | 107,155 | 30 | |
| Gross Profit | 39,608 | 33,777 | 17 | 48,135 | 38,569 | 25 | 55,596 | 42,724 | 30 | |
| Operating Profit | 19,191 | 15,485 | 24 | 24,054 | 18,365 | 31 | 29,015 | 20,742 | 40 | |
| Pre-tax Income | 20,165 | 16,634 | 21 | 24,916 | 19,490 | 28 | 29,887 | 22,268 | 34 | |
| Net Income | 16,433 | 13,557 | 21 | 20,269 | 15,834 | 28 | 24,298 | 17,885 | 36 | |
| EPS | 18.97 | 15.56 | 22 | 23.40 | 18.15 | 29 | 28.05 | 20.60 | 36 | |
| Operating Ratios (%) | UBS Consensus | UBS Consensus | Diff (ppt) | UBS Consensus | UBS Consensus | Diff (ppt) | UBS Consensus | UBS Consensus | UBS Consensus | Diff (ppt) |
| Gross Margin | 39.0 | 39.4 | -0.4 | 39.2 | 39.8 | -0.6 | 40.0 | 39.9 | 0.1 | |
| Operating Margin | 18.9 | 18.1 | 0.8 | 19.6 | 18.9 | 0.6 | 20.9 | 19.4 | 1.5 | |
| Pre-tax Margin | 19.9 | 19.4 | 0.5 | 20.3 | 20.1 | 0.2 | 21.5 | 20.8 | 0.7 | |
| Net Margin | 16.2 | 15.8 | 0.4 | 16.5 | 16.3 | 0.2 | 17.5 | 16.7 | 0.8 |
Source: Refinitiv, UBS estimates
Figure 3: Advantech's PE (x) band
Source: Refinitiv, UBS estimates
Figure 5: Peer valuation comparison table
| Mkt Cap | Price | P/E | P/E | P/BV | P/BV | Earnings growth (%) | Earnings growth (%) | ROE (%) | ROE (%) | ||
|---|---|---|---|---|---|---|---|---|---|---|---|
| Company | Ticker | (US$m) | (LC$) | 2026E | 2027E | 2026E | 2027E | 2026E | 2027E | 2026E | 2027E |
| Advantech | 2395.TW | 14,181 | 530.00 | 27.9 | 22.7 | 7.4 | 6.9 | 55.1 | 23.3 | 28.2 | 31.5 |
| *Posiflex Technology Inc | 8114.TW | 462 | 194.00 | 7.4 | 6.4 | 1.3 | 1.2 | n.a. | n.a. | 23.1 | 22.3 |
| *Ennoconn Corp | 6414.TW | 1,816 | 400.00 | 15.7 | 13.6 | 2.0 | 1.8 | n.a. | n.a. | 11.4 | 11.9 |
| *ADLINK Technology Inc | 6166.TW | 867 | 128.00 | 22.1 | 18.7 | - | - | n.a. | n.a. | 19.1 | 19.9 |
| Siemens | SIEGn.DE | 244,007 | 270.70 | 23.3 | 20.7 | 3.2 | 3.0 | 6.6 | 12.4 | 14.2 | 15.1 |
| ABB Ltd | ABBN.S | 177,835 | 78.26 | 32.3 | 29.7 | 8.1 | 6.9 | 21.8 | 7.2 | 29.2 | 25.1 |
| Schneider Electric | SCHN.PA | 172,693 | 264.35 | 25.8 | 21.9 | 5.7 | 5.2 | 3.1 | 17.7 | 22.9 | 24.8 |
| Hexagon AB | HEXAb.ST | 22,327 | 80.10 | 14.4 | 13.0 | 1.6 | 1.5 | 10.9 | 9.5 | 11.5 | 11.7 |
| Rockwell Automation Inc | ROK.N | 52,632 | 468.67 | 35.8 | 32.0 | 13.6 | 12.6 | 22.1 | 9.7 | 38.6 | 40.4 |
| Average | 22.8 | 19.8 | 5.4 | 4.9 | 19.9 | 13.3 | 22.0 | 22.5 | |||
| Median | 23.3 | 20.7 | 4.5 | 4.1 | 16.3 | 11.1 | 22.9 | 22.3 |
Source: Company data, Refinitiv, UBS estimates. *Consensus estimates; others are UBS estimates. Priced as of 16 July 2026.
•- 1 STD
Avg.
- 1STD
Figure 4: Advantech's PB (x) band
Source: Refinitiv, UBS estimates
6.3
5.7
5.0
4.4
2026
-+2STD
Advantech (2395.TW)
| Income Statement (NT$m) | 12/23 | 12/24 | 12/25 | 12/26E | %ch | 12/27E | %ch | 12/28E | 12/29E | 12/30E |
|---|---|---|---|---|---|---|---|---|---|---|
| Revenues | 64,568 | 59,786 | 70,882 | 101,482 | 43.2 | 122,794 | 21.0 | 138,990 | 151,290 | 162,715 |
| Gross profit | 26,162 | 24,376 | 28,198 | 39,608 | 40.5 | 48,135 | 21.5 | 55,596 | 60,516 | 65,086 |
| EBITDA (UBS) | 13,214 | 10,144 | 12,777 | 20,372 | 59.5 | 25,465 | 25.0 | 30,501 | 33,184 | 35,681 |
| Depreciation & amortisation | (1,086) | (1,094) | (1,210) | (1,181) | 2.4 | (1,411) | -19.5 | (1,486) | (1,566) | (1,650) |
| EBIT (UBS) | 12,128 | 9,050 | 11,567 | 19,191 | 65.9 | 24,054 | 25.3 | 29,015 | 31,619 | 34,030 |
| Associates & investment income | 389 | 399 | 362 | 324 | -10.6 | 330 | 2.0 | 337 | 344 | 351 |
| Other non-operating income | 520 | 1,232 | 508 | 450 | -11.4 | 375 | -16.8 | 375 | 375 | 375 |
| Net interest | 230 | 294 | 252 | 199 | -21.0 | 157 | -21.2 | 160 | 204 | 227 |
| Exceptionals (incl goodwill) | 0 | 0 | 0 | 0 | - | 0 | - | 0 | 0 | 0 |
| Pre-tax profit | 13,267 | 10,975 | 12,690 | 20,165 | 58.9 | 24,916 | 23.6 | 29,887 | 32,542 | 34,983 |
| Tax | (2,477) | (2,086) | (2,189) | (3,812) | -74.2 | (4,659) | -22.2 | (5,589) | (6,085) | (6,542) |
| Profit after tax | 10,789 | 8,888 | 10,501 | 16,353 | 55.7 | 20,257 | 23.9 | 24,298 | 26,456 | 28,441 |
| Preference dividends | 0 | 0 | 0 | 0 | - | 0 | - | 0 | 0 | 0 |
| Minorities | 48 | 117 | 92 | 80 | -12.7 | 12 | -84.5 | 0 | 0 | 0 |
| Extraordinary | 0 | - | 0 | - | 0 | 0 | 0 | |||
| items Net earnings (local GAAP) | 10,838 | 0 9,005 | 0 10,593 | 0 16,433 | 55.1 | 20,269 | 23.3 | 24,298 | 26,456 | 28,441 |
| Net earnings (UBS) | 10,838 | 9,005 | 10,593 | 20,269 | 23.3 | 24,298 | 26,456 | 28,441 | ||
| Tax rate (%) | 18.7 | 19.0 | 17.3 | 16,433 18.9 | 55.1 9.6 | 18.7 | -1.1 | 18.7 | 18.7 | 18.7 |
| Per Share (NT$) | 12/23 | 12/24 | 12/25 | 12/26E | %ch | 12/27E | %ch | 12/28E | 12/29E | 12/30E |
| EPS (UBS, diluted) | 12.65 | 10.38 | 12.14 | 18.85 | 55.3 | 23.25 | 23.3 | 27.88 | 30.35 | 32.63 |
| EPS (local GAAP, diluted) | 12.65 | 10.38 | 12.14 | 18.85 | 55.3 | 23.25 | 23.3 | 27.88 | 30.35 | 32.63 |
| EPS (UBS, basic) | 12.65 | 12.25 | 18.97 | 23.40 | 28.05 | |||||
| DPS (net) (NT$) | 9.99 | 10.45 | 11.20 | 54.8 | 17.34 | 23.3 | 21.39 | 30.54 25.64 | 32.83 | |
| Cash EPS (UBS, diluted) 1 | 13.92 | 9.45 11.64 | 8.39 13.53 | 20.21 | 33.5 49.4 | 24.87 | 54.8 23.1 | 29.58 | 32.15 | 27.91 34.52 |
| Book value per share | 56.59 | 59.58 | 63.66 | 71.48 | 12.3 | 77.28 | 8.1 | 83.94 | 88.84 | 93.76 |
| Average shares (diluted) | 857 | 868 | 873 | 872 | -0.1 | 872 | 0.0 | 872 | 872 | 872 |
| Balance Sheet (NT$m) | 12/23 | 12/24 | 12/25 | 12/26E | %ch | 12/27E | %ch | 12/28E | 12/29E | 12/30E |
| Cash and equivalents | 11,012 | 13,617 | 11,317 | 9,636 | -14.9 | 9,752 | 1.2 | 11,513 | 12,414 56,462 | 13,459 60,061 |
| Other current assets Total current assets | 30,374 | 28,583 | 31,178 | 41,047 50,683 | 31.7 | 47,759 57,511 | 16.4 13.5 | 52,588 64,101 | 68,877 | 73,520 |
| Net tangible fixed assets | 41,386 11,326 | 42,200 12,244 | 42,496 14,452 | 16,282 | 19.3 12.7 | 16,879 | 3.7 | 17,513 | 18,187 | 18,903 |
| Net intangible fixed assets | 2,750 | 2,814 | 2,735 | 2,517 | -8.0 | 2,299 | -8.7 | 2,081 | 1,864 | 1,646 |
| Investments / other assets | 13,594 | 14,484 | 16,036 | 16,360 | 2.0 | 16,690 | 2.0 | 17,027 | 17,371 | 17,721 |
| 8.8 | ||||||||||
| Total assets | 69,056 | 71,742 | 75,718 | 85,842 | 13.4 | 93,379 | 100,722 | 106,297 | 111,790 | |
| Trade payables & other ST liabilities | 15,671 | 15,453 | 16,440 | 19,893 | 21.0 | 22,194 | 11.6 | 23,766 | 25,094 | 26,327 77 |
| Short term debt Total current liabilities | 356 16,027 | 116 | 77 16,517 | 77 19,970 | 0.0 20.9 | 77 22,271 | 0.0 11.5 | 77 23,843 | 77 | 26,404 |
| Long term debt | 0 | 15,569 156 | 150 | 150 | 0.0 | 150 | 0.0 | 150 | 25,171 150 | 150 |
| 4,220 | 4,219 | 4,001 | 0.0 | 4,001 | 0.0 | 4,001 | 4,001 | 4,001 | ||
| Other long term liabilities Preferred shares | 0 | 0 | 4,001 0 | - | 0 | - | 0 | 0 | 0 | |
| Total liabilities (incl pref shares) | 20,247 | 19,945 | 0 20,668 | 24,121 | 16.7 | 26,422 | 9.5 | 27,994 | 29,322 | 30,555 |
| Common s/h equity | 348 | 369 | 102 | 22 | -78.9 | 9 | -57.9 | 9 | 76,967 | |
| Minority interests | 48,461 | 51,428 | 54,947 | 61,699 | 12.3 | 66,948 | 8.5 | 72,719 | 9 | 81,226 |
| Total liabilities & equity | 69,056 | 71,742 | 75,718 | 85,842 | 13.4 | 93,379 | 8.8 | 100,722 | 106,297 | 9 111,790 |
| Cash Flow (NT$m) | 12/23 | 12/24 | 12/25 | 12/26E | %ch | 12/27E | %ch | 12/28E | 12/29E | 12/30E |
| Net income (before pref divs) | 10,838 | 9,005 | 10,593 | 16,433 | 55.1 | 20,269 | 23.3 | 24,298 1,486 | 26,456 | 28,441 |
| Depreciation & amortisation capital | 1,086 | 1,094 | 1,210 | 1,181 | -2.4 | 1,411 (4,412) | 19.5 | 1,566 (2,546) | 1,650 | |
| Net change in working | 5,006 (7,265) | (596) 1,008 | (906) (993) | (6,416) | NM 59.3 | (343) | 31.2 15.2 | (3,257) (337) | (344) | (2,365) |
| Other operating Operating cash | 9,665 (1,236) | (404) | 9.0 | 22,189 | (351) | |||||
| flow | 10,511 | 9,903 | 10,794 | 16,926 | 56.8 | 25,132 | 27,375 | |||
| Tangible capital expenditure | (1,505) | (2,837) | (2,793) | 1.5 | (1,790) | 35.9 | (1,902) | (2,022) | (2,149) | |
| Intangible capital expenditure | 0 | 0 | 0 | 0 | - | 0 | - | 0 | 0 | 0 |
| Net (acquisitions) & disposals | 0 | 0 | 0 | - | 0 | - | 0 | 0 0 | 0 | |
| Other investing Investing cash flow | (1,337) (2,573) | 1,036 | 0 (1,384) | 0 | - | 0 | 0 | 0 | ||
| (470) | (4,221) | (2,793) | 33.8 | (1,790) | - 35.9 | (1,902) | (2,022) | (2,149) | ||
| Equity dividends paid | (7,800) 0 | (8,158) 0 | (7,259) 0 | (9,682) | -33.4 | (15,020) 0 | -55.1 - | (18,527) 0 | (22,209) 0 | (24,182) 0 |
| Share issues / | - | |||||||||
| (buybacks) Other financing | 12 | 477 | (526) | 0 0 | - | 0 | - | 0 | 0 | 0 |
| Change in debt & pref shares | (276) | (111) | (61) | 0 | - | 0 (15,020) | - | 0 (18,527) | 0 (22,209) | 0 (24,182) |
| Financing cash flow Cash flow inc/(dec) in | (8,064) (972) | (7,792) | (7,846) (2,163) | (9,682) | -23.4 22.3 | -55.1 | 1,760 | 1,045 | ||
| cash | (1,681) | 116 0 | - | 901 | ||||||
| FX / non cash items cash | (46) | 2,249 357 | (136) (2,300) | 0 | - | 116 | - | 0 1,760 | 0 | 0 |
| 2,605 | (1,681) | 26.9 | ||||||||
| Balance sheet inc/(dec) in | (1,018) | - | 901 | 1,045 |
Source: Company accounts, UBS estimates. (UBS) metrics use reported figures which have been adjusted by UBS analysts. 1 Cash EPS (UBS, diluted) is calculated using UBS net income adding back depreciation and amortization.
Advantech (2395.TW)
| Valuation (x) | 12/23 | 12/24 | 12/25 | 12/26E | 12/27E | 12/28E | 12/29E | 12/30E |
|---|---|---|---|---|---|---|---|---|
| P/E (local GAAP, diluted) | 27.5 | 34.2 | 27.9 | 28.1 | 22.8 | 19.0 | 17.5 | 16.2 |
| P/E (UBS, diluted) | 27.5 | 34.2 | 27.9 | 28.1 | 22.8 | 19.0 | 17.5 | 16.2 |
| P/CEPS | 25.0 | 30.3 | 24.8 | 26.1 | 21.2 | 17.8 | 16.4 | 15.3 |
| Equity FCF (UBS) yield% | 2.8 | 3.0 | 2.4 | 1.7 | 3.3 | 4.4 | 5.1 | 5.5 |
| Dividend yield (net)% | 2.9 | 2.7 | 2.5 | 2.1 | 3.3 | 4.0 | 4.8 | 5.3 |
| P/BV | 6.2 | 6.0 | 5.3 | 7.4 | 6.9 | 6.3 | 6.0 | 5.7 |
| EV/revenues (core) | 4.4 | 4.8 | 3.9 | 4.4 | 3.6 | 3.2 | 2.9 | 2.7 |
| EV/EBITDA (UBS core) | 21.4 | 28.4 | 21.5 | 21.7 | 17.4 | 14.5 | 13.2 | 12.3 |
| EV/EBIT (core) | 23.3 | 31.8 | 23.8 | 23.0 | 18.4 | 15.2 | 13.9 | 12.9 |
| EV/OpFCF (core) | 20.8 | 29.0 | 22.2 | 22.7 | 17.8 | 14.7 | 13.4 | 12.4 |
| EV/op. invested capital | 9.1 | 8.6 | 7.6 | 10.3 | 9.0 | 8.2 | 7.7 | 7.3 |
| Enterprise value (NT$m) | 12/23 | 12/24 | 12/25 | 12/26E | 12/27E | 12/28E | 12/29E | 12/30E |
| Market cap. | 297,710 | 304,654 | 292,051 | 457,480 | 457,480 | 457,480 | 457,480 | 457,480 |
| Net debt (cash) | (11,016) | (12,000) | (12,217) | (10,249) | (9,467) | (10,405) | (11,736) | (12,709) |
| Buy out of minorities | 348 | 369 | 102 | 22 | 9 | 9 | 9 | 9 |
| Pension provisions/other | 0 | 0 | 0 | 0 | 0 | 0 | 0 | 0 |
| Total enterprise value | 287,043 | 293,022 | 279,936 | 447,252 | 448,022 | 447,084 | 445,753 | 444,780 |
| Non core assets | (4,705) | (4,993) | (5,113) | (5,436) | (5,767) | (6,104) | (6,448) | (6,798) |
| Core enterprise value | 282,338 | 288,029 | 274,823 | 441,816 | 442,255 | 440,980 | 439,305 | 437,981 |
| Growth (%) | 12/23 | 12/24 | 12/25 | 12/26E | 12/27E | 12/28E | 12/29E | 12/30E |
| Revenue | (6.1) | (7.4) | 18.6 | 43.2 | 21.0 | 13.2 | 8.8 | 7.6 |
| EBITDA (UBS) | (2.8) | (23.2) | 26.0 | 59.5 | 25.0 | 19.8 | 8.8 | 7.5 |
| EBIT (UBS) | (3.2) | (25.4) | 27.8 | 65.9 | 25.3 | 20.6 | 9.0 | 7.6 |
| EPS (UBS, diluted) | (8.7) | (18.0) | 17.0 | 54.7 | 23.8 | 19.9 | 8.9 | 7.5 |
| Net DPS | 25.2 | (5.4) | (11.2) | 33.5 | 54.8 | 23.3 | 19.9 | 8.9 |
| Margins & Profitability (%) | 12/23 | 12/24 | 12/25 | 12/26E | 12/27E | 12/28E | 12/29E | 12/30E |
| Gross profit margin | 40.5 | 40.8 | 39.8 | 39.0 | 39.2 | 40.0 | 40.0 | 40.0 |
| EBITDA margin | 20.5 | 17.0 | 18.0 | 20.1 | 20.7 | 21.9 | 21.9 | 21.9 |
| EBIT (UBS) margin | 18.8 | 15.1 | 16.3 | 18.9 | 19.6 | 20.9 | 20.9 | 20.9 |
| Net earnings (UBS) margin | 16.8 | 15.1 | 14.9 | 16.2 | 16.5 | 17.5 | 17.5 | 17.5 |
| ROIC (EBIT) | 39.1 | 27.1 | 32.0 | 44.8 | 48.8 | 54.2 | 55.6 | 56.9 |
| ROIC post tax | 31.6 | 21.7 | 26.3 | 36.1 | 39.6 | 44.0 | 45.1 | 46.2 |
| ROE (UBS) | 23.5 | 18.0 | 19.9 | 28.2 | 31.5 | 34.8 | 35.3 | 36.0 |
| Capital structure & Coverage (x) | 12/23 | 12/24 | 12/25 | 12/26E | 12/27E | 12/28E | 12/29E | 12/30E |
| Net debt / EBITDA | (0.8) | (1.3) | (0.9) | (0.5) | (0.4) | (0.4) | (0.4) | (0.4) |
| Net debt / total equity% | (21.8) | (25.8) | (20.1) | (15.2) | (14.2) | (15.5) | (15.8) | (16.3) |
| Net debt / (net debt + total equity)% | (27.9) | (34.7) | (25.2) | (18.0) | (16.6) | (18.4) | (18.8) | (19.5) |
| Net debt/EV% | (3.8) | (4.1) | (4.4) | (2.3) | (2.1) | (2.3) | (2.6) | (2.9) |
| Capex / depreciation% | 135.5 | 161.2 | NM | NM | 150.0 | 150.0 | 150.0 | 150.0 |
| Capex / revenue% | 1.9 | 2.5 | 4.0 | 2.8 | 1.5 | 1.4 | 1.3 | 1.3 |
| EBIT / net interest | - | - | - | - | - | - | - | - |
| Dividend cover (UBS) | 1.3 | 1.1 | 1.5 | 1.7 | 1.3 | 1.3 | 1.2 | 1.2 |
| Div. payout ratio (UBS)% | 79.0 | 90.4 | 68.5 | 59.3 | 74.1 | 76.2 | 83.9 | 85.0 |
| Revenues by division (NT$m) | 12/23 | 12/24 | 12/25 | 12/26E | 12/27E | 12/28E | 12/29E | 12/30E |
| Others | 64,568 | 59,786 | 70,882 | 101,482 | 122,794 | 138,990 | 151,290 | 162,715 |
| Total | 64,568 | 59,786 | 70,882 | 101,482 | 122,794 | 138,990 | 151,290 | 162,715 |
| EBIT (UBS) by division (NT$m) | 12/24 | 12/25 | 12/26E | 12/27E | 12/28E | 12/30E | ||
| 12/23 | 11,567 | 19,191 | 12/29E | 34,030 | ||||
| Others | 12,128 | 9,050 9,050 | 19,191 | 24,054 24,054 | 29,015 | 31,619 | 34,030 | |
| Total | 12,128 | 11,567 | 29,015 | 31,619 |
Source: Company accounts, UBS estimates. (UBS) metrics use reported figures which have been adjusted by UBS analysts.
Forecast returns
| Forecast price appreciation | 18.5% |
|---|---|
| Forecast dividend yield | 2.1% |
| Forecast stock return | 20.6% |
| Market return assumption | 6.3% |
| Forecast excess return | 14.3% |
Company Description
Established in 1981 and listed on the Taiex in 1999, Advantech is a world-leading Taiwanese IPC supplier. Its product offerings involve embedded boards and chassis, industrial computers and controls, and after-sales services with applications spanning manufacturing automation, healthcare, transportation, energy and networking industries. To serve the global market, it has three manufacturing sites in Taiwan, Japan and China and direct subsidiaries in 27 countries.
Valuation Method and Risk Statement
We base our price target for Advantech on 27x 2027E PE.
Industrial PC sector risks include: slower global economic growth; uncertainty in trade tariff negotiations; higher interest rates that could result in weaker capex investment; readiness and supply chain bottlenecks of IT technology could slow project execution; currency movements; and changes in component pricing that could bring downside to profitability. In our view, key company-specific risks include: 1) slower-than-expected edge-AI product adoption; 2) competition in the non-AI IPC segment, especially in the China market; 3) a rise in component prices; 4) NTD appreciation against the USD; 5) slower macroeconomic growth that could negatively impact overall capex allocation; and 6) demand growth that could attract more new suppliers to join the market, which might intensify competition and possibly bring price pressure.
Quantitative Research Review
UBS Global Research publishes a quantitative assessment of its analysts' responses to certain questions about the likelihood of an occurrence of a number of short term factors in a product known as the 'Quantitative Research Review'. The views for this month can be found below. Views contained in this assessment on a particular stock reflect only the views on those short term factors which are a different timeframe to the 12-month timeframe reflected in any equity rating set out in this note. For previous responses please make reference to (i) previous UBS Global Research reports; and (ii) where no applicable research report was published that month, the Quantitative Research Review which can be found at https://neo.ubs.com/quantitative, or contact your UBS sales representative for access to the report or the Quantitative Research Team on ubs-quant-answers@ubs.com. A consolidated report which contains all responses is also available and again you should contact your UBS sales representative for details and pricing or the Quantitative Research Team on the email above.
Advantech
| Question | Response |
|---|---|
| 1. Is the industry structure facing the firm likely to improve or deteriorate over the next six months? Rate on a scale of 1-5 (1 = getting worse, 3 = no change, 5 = getting better, N/A = no view) | 4 |
| 2. Is the regulatory/government environment facing the firm likely to improve or deteriorate over the next six months? Rate on a scale of 1-5 (1 = getting tougher 3 = no change, 5 = getting better, N/A = no view) | 3 |
| 3. Over the last 3-6 months in broad terms have things been improving/no change/getting worse for this stock? Rate on a scale of 1-5 (1 = getting a lot worse, 3 = not much change, 5 = getting a lot better, N/A = no view) | 4 |
| 4. Relative to the current CONSENSUS EPS forecast, is the next company EPS update likely to lead to: (1 = negative surprise vs consensus, 3 = in-line with consensus, 5 = positive surprise vs consensus expectations, N/A = no view) | 4 |
| 5. What's driving the difference? | |
| 6. Relative to YOUR current earnings forecast, is there relatively greater risk at the next earnings result of:(1 = downside skew risk to earnings, 3 = equal upside or downside risk to earnings, 5 = upside skew risk to earnings, N/A = no view) | 3 |
| 7. What's driving the difference? | |
| 8. Is there an upcoming catalyst for the company over the next three months? | Positive Catalyst |
| 9. Is there an actual or approximate date for the catalyst? | August 5, 2026 |
| 10. Is the catalyst date an actual or approximate date? | N/A |
| 11. What is the catalyst? | analyst meeting |
Required Disclosures
This document has been prepared by UBS Securities Pte. Ltd., Taipei Branch, an affiliate of UBS AG. UBS AG, its subsidiaries, branches and affiliates, including former Credit Suisse AG and its subsidiaries, branches and affiliates are referred to herein as "UBS".
For information on the ways in which UBS manages conflicts and maintains independence of its UBS Global Research product; historical performance information; certain additional disclosures concerning UBS Global Research recommendations; and terms and conditions for certain third party data used in research report, please visit https://www.ubs.com/disclosures. Unless otherwise indicated, information and data in this report are based on company disclosures including but not limited to annual, interim, quarterly reports and other company announcements. The figures contained in performance charts refer to the past; past performance is not a reliable indicator of future results. Additional information will be made available upon request. UBS Securities Co. Limited is licensed to conduct securities investment consultancy businesses by the China Securities Regulatory Commission. UBS acts or may act as principal in the debt securities (or in related derivatives) that may be the subject of this report. This recommendation was finalized on: 17 July 2026 04:03 AM GMT. UBS has designated certain UBS Global Research department members as Derivatives Research Analysts where those department members publish research principally on the analysis of the price or market for a derivative, and provide information reasonably sufficient upon which to base a decision to enter into a derivatives transaction. Where Derivatives Research Analysts coauthor research reports with Equity Research Analysts or Economists, the Derivatives Research Analyst is responsible for the derivatives investment views, forecasts, and/or recommendations. Quantitative Research Review: UBS Global Research publishes a quantitative assessment of its analysts' responses to certain questions about the likelihood of an occurrence of a number of short term factors in a product known as the 'Quantitative Research Review'. Views contained in this assessment on a particular stock reflect only the views on those short term factors which are a different timeframe to the 12-month timeframe reflected in any equity rating set out in this note. For the latest responses, please see the Quantitative Research Review Addendum at the back of this report, where applicable. For previous responses please make reference to (i) previous UBS Global Research reports; and (ii) where no applicable research report was published that month, the Quantitative Research Review which can be found at https://neo.ubs.com/ quantitative, or contact your UBS sales representative for access to the report or the Quantitative Research Team on ubs-quantanswers@ubs.com. A consolidated report which contains all responses is also available and again you should contact your UBS sales representative for details and pricing or the Quantitative Research team on the email above.