PDF 原檔:報告_UBS_南茂8150_20260715_original.pdf
圖片清單(已驗證 2026-07-17)
| 檔名 | size | 分類 | 親眼所見內容 |
|---|---|---|---|
260715_ubs_chipmos_006.png |
154KB | 真資料圖 | ChipMOS 股價(NT$,黑線)疊圖目標價(藍線)沿革圖 2023-04 至 2026-06,右側附評等/日期明細表:2023-04-14 No Rating 起共 9 筆紀錄,最新 2026-05-12 股價 87.00、TP 105.00、Buy(本次報告文字「raise PT from NT$105 to NT$156」與此吻合,確認為 ChipMOS 自身資料) |
260715_ubs_chipmos_005.png |
98KB | 真資料圖 | 另一份股價(黑線)疊圖目標價(藍線)沿革圖 2023-04 至 2026-06,形態與 006 相似但 Y 軸尺度達 400(股價峰值約 320),與 ChipMOS 本身股價量級(現價僅 NT$114)不符,且此圖缺日期/數值明細表可供核對,判斷極可能為報告內鄰近的同業比較圖(如京元電 NT$307、Powertech NT$314 量級相近),非 ChipMOS 專屬圖表,故不採用於公司頁 |
260715_ubs_chipmos_004.png |
88KB | 真資料圖 | ChipMOS Upside/Downside Spectrum 圖表:股價 TWD 114.0(15 Jul),Downside NT$60 / Base NT$156 / Upside NT$220;下方 Value drivers 表列出 2026E/2027E 三情境的 YoY sales growth、assembly+testing sales growth、Gross margin、Operating margin 數值 |
260715_ubs_chipmos_002.png |
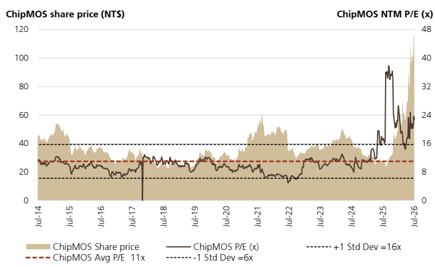
44KB | 真資料圖 | ChipMOS 股價(米色區塊,NT$,左軸)疊圖 NTM P/E(黑線,右軸)2014-2026,標示歷史均值 11x(紅虛線)與 ±1 Std Dev(16x/6x),2025-2026 股價與 P/E 同步暴衝突破區間 |
260715_ubs_chipmos_003.png |
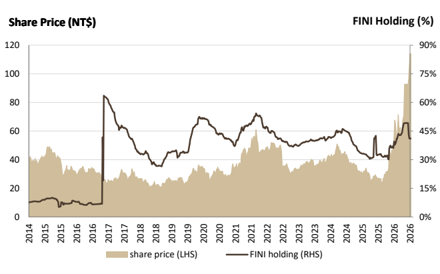
39KB | 真資料圖 | ChipMOS 股價(米色區塊,左軸)疊圖 FINI(外資)持股比例(黑線,右軸)2014-2026,外資持股 2026 年明顯回升至逾 60% |
260715_ubs_chipmos_001.png |
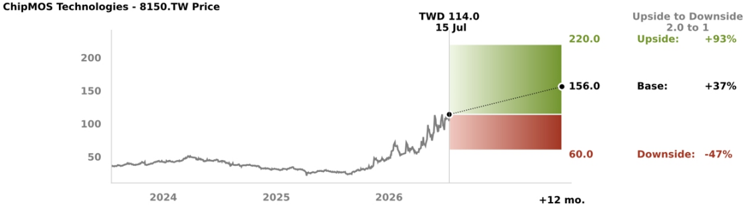
39KB | 真資料圖 | ChipMOS 股價 Upside/Downside Spectrum(同 004 精簡版):股價 TWD 114.0,Downside NT$60(-47%)/ Base NT$156(+37%)/ Upside NT$220(+93%),Upside to Downside 比 2.0 to 1 |
分類只有三類:
真資料圖/裝飾·logo·banner/文字卡。<40KB 未 Read 者免列(本報告全數 6 張皆 ≥38KB 且已逐張 Read)。
原始內容
ChipMOS Technologies
AI initiatives to accelerate mid-term growth
Raising estimates on robust memory demand and SiPh/Logic upside
We see improving momentum in ChipMOS's memory business into H226, driven by rising DDR4/DDR5 output, stronger Flash demand and increased outsourcing. We expect this trend to be sustained into 2027, with potential ASP upside on rising component costs. For the driver IC business, we believe recent rush orders ahead of wafer price hikes and allocation shifting back to Taiwanese players on capacity tightness will support the near-term outlook. Meanwhile, SiPh/optical bumping is progressing through customer engagement and qualification, on track for a revenue contribution as of 2027. The company has noted that it is adding logic testers, and we believe they could also be used for smartphone/ASIC testing, which could be a new driver as of 2027. We raise our 2026E/2027E/2028E EPS 4%/14%/19%, on sustained memory strength and new AI initiatives (SiPh and logic testing). We reiterate our Buy rating and raise our PT from NT$105 to NT$156, on 23x 2027-28E average PE (from 19x 2027E PE).
Growth to accelerate as of 2027E on new project ramp-ups
ChipMOS has been engaging SiPh/optical customers, leveraging its bumping capability. Among solder, copper and gold bumping, we think copper bumping for optical chips will progress faster (vs. gold bumping for Chipbond), with a more meaningful revenue contribution likely as of 2027. ChipMOS is also adding new PS5000 testers for logic customers. We believe this new testing platform opens the opportunity to enter AI imaging SoC, smartphone processor and ASIC applications. We estimate SiPh/optical and new logic testing business to account for 6%/10% of sales in 2027/2028, albeit a higher ~ 10%/15% of EPS, given a superior margin profile.
Q226 revenue tracking in line; momentum to be sustained into H226E
ChipMOS's sales reached NT$2,538m in June, up 6.5% MoM and 37% YoY, for Q226 sales of NT$7,383m (6.5% QoQ growth), broadly in line with the UBS/consensus estimates. We estimate driver IC and bumping had stronger QoQ growth on rush orders and price hikes, while memory sales were temporarily impacted by lower DDR5 output on customers' product transition, despite stronger testing demand. We expect Q226 GM to rise 3.4ppt QoQ to 17.2% on better pricing and a more favourable mix, with EPS at NT$1.03 (+42% QoQ). We expect Q326 sales to grow 8% QoQ on driver IC restocking and better DDR4/5 volume, while GM may improve another 0.7ppt QoQ to 17.9%, on greater scale, offset by higher electricity cost. We expect Q426 sales to stay flattish, with steady memory demand, offset by a seasonal driver IC slowdown.
Valuation: Raise price target to NT$156; reiterate Buy rating
Our PT of NT$156 is based on 23x average 2027-28E PE (vs. a 5-27x historical normalized range), in line with the average of OSAT peers. We do not believe its improving business outlook and new opportunities from SiPh/logic testing have been priced in. We expect the stock to rise further as consensus EPS estimates climb.
| Highlights (NT$m) | 12/23 | 12/24 | 12/25 | 12/26E | 12/27E | 12/28E | 12/29E | 12/30E |
|---|---|---|---|---|---|---|---|---|
| Revenues | 21,356 | 22,696 | 23,933 | 30,223 | 35,178 | 38,868 | 42,060 | 45,439 |
| EBIT (UBS) | 1,908 | 1,274 | 1,143 | 3,253 | 5,026 | 6,001 | 6,702 | 7,474 |
| Net earnings (UBS) | 1,893 | 1,420 | 495 | 2,906 | 4,336 | 5,148 | 5,774 | 6,544 |
| EPS (UBS, diluted) (NT$) | 2.60 | 1.95 | 0.69 | 4.15 | 6.19 | 7.35 | 8.25 | 9.35 |
| DPS (net) (NT$) | 2.30 | 1.80 | 1.23 | 1.25 | 2.08 | 3.10 | 3.68 | 4.12 |
| Net (debt) / cash | (2,558) | 1,121 | (612) | (3,436) | (5,242) | (3,816) | (1,354) | 1,530 |
| Profitability/valuation | 12/23 | 12/24 | 12/25 | 12/26E | 12/27E | 12/28E | 12/29E | 12/30E |
| EBIT (UBS) margin% | 8.9 | 5.6 | 4.8 | 10.8 | 14.3 | 15.4 | 15.9 | 16.4 |
| ROIC (EBIT)% | 9.8 | 5.0 | 4.8 | 12.1 | 15.9 | 17.2 | 18.6 | 20.4 |
| EV/EBITDA (UBS core) x | 3.6 | 4.9 | 3.5 | 9.8 | 8.2 | 7.5 | 6.9 | 6.3 |
| P/E (UBS, diluted) x | 14.6 | 20.8 | 44.9 | 27.5 | 18.4 | 15.5 | 13.8 | 12.2 |
| Equity FCF (UBS) yield% | 13.1 | 18.1 | 1.8 | (1.3) | (0.4) | 4.5 | 6.3 | 7.3 |
| Dividend yield (net)% | 6.0 | 4.4 | 4.0 | 1.1 | 1.8 | 2.7 | 3.2 | 3.6 |
Source: Company accounts, LSEG Eikon, UBS estimates. Metrics marked as (UBS) have had analyst adjustments applied. Valuations: based on an average share price that year, (E): based on a share price of NT$ 114.00 on 15-Jul-2026
| Equities | Equities | Equities | Equities |
|---|---|---|---|
| Taiwan | Taiwan | Taiwan | Taiwan |
| Semiconductors | Semiconductors | Semiconductors | Semiconductors |
| 12-month rating | 12-month rating | 12-month rating | Buy |
| 12m price target | 12m price target | 12m price target | NT$156.00 Prior : NT$105.00 |
| Price (15 Jul 2026) | Price (15 Jul 2026) | Price (15 Jul 2026) | NT$114.00 |
| RIC: 8150.TW BBG: 8150 TT | RIC: 8150.TW BBG: 8150 TT | RIC: 8150.TW BBG: 8150 TT | RIC: 8150.TW BBG: 8150 TT |
| Trading data and key metrics 52-wk | range | Trading data and key metrics 52-wk | NT$117.00-23.20 |
| Market cap. | Market cap. | Market cap. | NT$80.3b/US$2.50b |
| Shares o/s | Shares o/s | Shares o/s | 705m (ORD) |
| Free float | Free float | Free float | 82% |
| Avg. daily volume ('000) | Avg. daily volume ('000) | Avg. daily volume ('000) | 53,625 |
| Avg. daily value (m) | Avg. daily value (m) | Avg. daily value (m) | NT$5,057.7 |
| Common s/h equity (12/26E) | Common s/h equity (12/26E) | Common s/h equity (12/26E) | NT$26.1b |
| P/BV (12/26E) | P/BV (12/26E) | P/BV (12/26E) | 3.1x |
| Net debt to EBITDA (12/26E) | Net debt to EBITDA (12/26E) | Net debt to EBITDA (12/26E) | 0.4x |
| EPS (UBS, diluted) (NT$) | EPS (UBS, diluted) (NT$) | EPS (UBS, diluted) (NT$) | EPS (UBS, diluted) (NT$) |
| From | To | %ch Cons. | |
| 12/26E | 3.98 | 4.15 | 4 4.13 |
| 12/27E | 5.43 | 6.19 | 14 5.64 |
| 12/28E | 6.19 | 7.35 | 19 6.19 |
Jerry Su
Analyst jerry.su@ubs.com +886-28-722 7306
Annie Chen
Associate Analyst annie.chen@ubs.com +886-2-8722 7281
ChipMOS Technologies - 8150.TW Price
2025
TWD 114.0
15 Jul
220.0
Upside to Downside
2.0 to 1
Upside:
+93%
+37%
Thesis Map UBS Research THESIS MAP a guide to our thinking and what´s where in this report
100
Pivotal Questions
2024
UBS VIEW
evidence
WHAT´S PRICED IN?
Upside/Downside Spectrum
Company Description
Q: Will ChipMOS benefit from a recovery in memory demand and rising prices?
Yes. Tightness in AI-driven memory supply and price hikes have caused leading DRAM makers to prioritise HBM (high-bandwidth memory) supply, while the supply of DDR5/DDR4, niche DRAM and NAND Flash has also been constrained. ChipMOS has had improving order momentum from its memory customers, while better memory pricing has supported ASP increases since H225 to offset higher raw material costs and normalise margins. We believe ChipMOS could further raise its memory back-end ASP, supporting sales and GM expansion.
Q: Is ChipMOS's driver IC business recovering as a driver IC back-end supplier?
Yes. ChipMOS had strong demand for driver IC back-end in Q126, driven by customer restocking and pull-in ahead of rising DRAM pricing. It has negotiated higher prices with driver IC customers to pass on rising labour and electricity costs, at a time of tighter supply-demand as of H226, stemming from potential outsourcing by Korean customers. With memory and driver IC back-end GMs improving, we expect the overall GM to recover to the 20% level in 2027.
Q: Can it diversify beyond into new growth areas besides conventional DDIC and memory?
We see progress. ChipMOS is in the higher-entry-barrier OLED DDIC with a superior margin profile, which accounted for ~25% of DDIC sales in 2025. It is also leveraging its bumping know-how and entering into bumping for high-speed SiPh/optical components. Moreover, it is expanding logic testing into AI imaging and smartphone processors and could enter ASIC testing. We estimate SiPh/ optical bumping and logic testing to account for 6%/10% of 2026/2027 sales.
We reiterate our Buy rating and raise our 2026E/2027E/2208E EPS 4%/14%/19%, on sustaining memory demand and new SiPh/logic initiatives. We expect 2026/2027 sales to grow by 26%/16% YoY, with GM/OPM recovering to 17-20%/10.8-14.3% from Q225 troughs of 6.6%/-0.8%. We raise our PT from NT$105 to NT$156, based on 23x average 2027/2028E PE (from 19x 2027 PE) vs. a 5-27x historical normalized range, in line with the average of OSAT peers.
ChipMOS's testing and packaging business is skewed toward memory applications and grew 1520% YoY when the memory cycle recovered in 2014 and 2019-20, mainly driven by rising demand and prices. The display driver IC business had a steady 7% CAGR in 2012-20 before the pandemic, although momentum has moderated since then due to competition from China in the mid-range and low-end markets. As the pricing environment for memory and driver IC back-end improves, overall GM could normalise to 20%, supporting an earnings recovery in 2026-28E.
The stock has rallied 55% in the past three months on a memory upcycle and driver IC price hikes, ahead of TAIEX's 23%, but still trades at 18.4x 2027E PE vs. a historical normalized range of 5-27x. We expect it to continue re-rating on an improving revenue and GM outlook, with upside potential to consensus earnings estimates.
| Value drivers (2026E/2027E) | YoY sales growth | YoY assembly + testing sales growth | Gross margin | Operating margin |
|---|---|---|---|---|
| NT$220 upside | 30%/21% | 45%/26% | 18.2%/23.0% | 12.1%/17.3% |
| NT$156 base | 26%/16% | 40%/19% | 17.0%/20.2% | 10.8%/14.3% |
| NT$60 downside | 21%/11% | 33%/13% | 15.4%/17.0% | 9.0%/10.8% |
Source: UBS estimates
ChipMOS is a semiconductor back-end supplier, with ~45% of sales from display driver IC, ~45% from memory and ~10% from logic (TV SoC) and mixed signal IC (MEMS, PMIC).
Financial summary
Figure 1: UBS vs. consensus estimates
| 1Q26 | 2Q26E | 2Q26E | 2Q26E | 3Q26E | 3Q26E | 3Q26E | |
|---|---|---|---|---|---|---|---|
| (NT$m) | Actual | UBSe | UBSe prior | LSEG | UBSe | UBSe prior | LSEG |
| Revenue | 6,936 | 7,383 | 7,479 | 7,328 | 7,970 | 8,018 | 7,657 |
| - QoQ / YoY | 6.4% | 6.5% | 7.8% | 5.7% | 7.9% | 9.7% | 4.5% |
| Gross profit | 955 | 1,271 | 1,255 | 1,264 | 1,425 | 1,419 | 1,380 |
| - Gross margin | 13.8% | 17.2% | 16.8% | 17.3% | 17.9% | 17.7% | 18.0% |
| Operating profit | 520 | 792 | 791 | 782 | 941 | 939 | 879 |
| - OP margin | 7.5% | 10.7% | 10.6% | 10.7% | 11.8% | 11.7% | 11.5% |
| Non-Op | 78 | 139 | 114 | 67 | 112 | 111 | 85 |
| Pre-tax profit | 598 | 849 | 822 | 849 | 974 | 967 | 964 |
| Tax | 93 | 132 | 127 | 137 | 151 | 150 | 156 |
| - Tax rate | -16% | -16% | -16% | -16% | -16% | -16% | -16% |
| Net profit | 505 | 718 | 695 | 712 | 823 | 817 | 807 |
| EPS (NT$) | 0.72 | 1.03 | 0.98 | 1.00 | 1.18 | 1.15 | 1.14 |
Source: Company data, LSEG, UBS estimates
Figure 2: Summary of annual P&L estimates
| Ticker Shares outstanding (mn) | Ticker Shares outstanding (mn) | 8150.TW 700.0 | Current Price (NT$) Mkt cap (NT$ mn) | Current Price (NT$) Mkt cap (NT$ mn) | $114.0 $79,798 | $114.0 $79,798 |
|---|---|---|---|---|---|---|
| Year | 2025 | 2026E | 2027E | 2028E | 2029E | 2030E |
| Revenues (NT$ mn) | $23,933 | $30,223 | $35,178 | $38,868 | $42,060 | $45,439 |
| YoY Growth (%) | 26.3% | 16.4% | 10.5% | 8.2% | 8.0% | |
| Gross profit (NT$mn) | $2,592 | $5,146 | $7,121 | $8,260 | $9,105 | $10,022 |
| GM (%) | 10.8% | 17.0% | 20.2% | 21.3% | 21.6% | 22.1% |
| Operating profit (NT$mn) | $1,143 | $3,253 | $5,026 | $6,001 | $6,702 | $7,474 |
| OPM (%) | 4.8% | 10.8% | 14.3% | 15.4% | 15.9% | 16.4% |
| Net profit (NT$ mn) | $495 | $2,906 | $4,336 | $5,148 | $5,774 | $6,470 |
| EPS (NT$) | $0.69 | $4.15 | $6.19 | $7.35 | $8.25 | $9.24 |
| EPS growth (%) | 498.5% | 49.2% | 18.7% | 12.1% | 12.1% | |
| P/E (x) | 164.3 | 27.5 | 18.4 | 15.5 | 13.8 | 12.3 |
| Dividend yield (%) | 1.1% | 1.1% | 1.8% | 2.7% | 3.2% | 3.6% |
| P/B (x) | 3.4 | 3.1 | 2.7 | 2.5 | 2.3 | 2.1 |
| ROE (%) | 2.1% | 11.1% | 14.9% | 16.1% | 16.4% | 16.7% |
Source: Company data, UBS estimates
Figure 3: Summary of ChipMOS's annual and quarterly estimates
| Quarters | 1Q25 | 2Q25 | 3Q25 | 4Q25 | 1Q26 | 2Q26E | 3Q26E | 4Q26E |
|---|---|---|---|---|---|---|---|---|
| Revenues (NT$ mn) | $5,532 | $5,736 | $6,144 | $6,521 | $6,936 | $7,383 | $7,970 | $7,935 |
| -- QoQ Growth (%) | 2.5% | 3.7% | 7.1% | 6.1% | 6.4% | 6.5% | 7.9% | -0.4% |
| -- YoY Growth (%) | 2.1% | -1.3% | 1.2% | 20.8% | 25.4% | 28.7% | 29.7% | 21.7% |
| Gross profit | $518 | $379 | $760 | $935 | $955 | $1,271 | $1,425 | $1,494 |
| -- Gross Margin (%) | 9.4% | 6.6% | 12.4% | 14.3% | 13.8% | 17.2% | 17.9% | 18.8% |
| EBITDA | $1,425 | $1,302 | $1,636 | $1,880 | $1,766 | $2,063 | $2,238 | $2,323 |
| -- EBITDA Margin (%) | 25.8% | 22.7% | 26.6% | 28.8% | 25.5% | 27.9% | 28.1% | 29.3% |
| Non-op | $82 | ($682) | $69 | ($24) | $78 | $139 | $112 | $101 |
| Pre-tax profit (NT$ mn) | $198 | ($661) | $438 | $612 | $598 | $849 | $974 | $1,019 |
| Tax | $22 | ($128) | $86 | $112 | $93 | $132 | $151 | $158 |
| -- tax rate (%) | 11.0% | 19.4% | 19.7% | 18.3% | 15.6% | 15.5% | 15.5% | 15.5% |
| Net profit (NT$ mn) | $176 | ($533) | $352 | $500 | $505 | $718 | $823 | $861 |
| -- QoQ Growth (%) | -24.1% | -402.4% | -166.1% | 41.9% | 1.0% | 42.1% | 14.6% | 4.7% |
| -- YoY Growth (%) | -59.7% | -218.3% | 17.6% | 115.2% | 186.4% | -234.6% | 133.6% | 72.4% |
| EPS (NT$) | $0.24 | -$0.75 | $0.50 | $0.70 | $0.72 | $1.03 | $1.18 | $1.23 |
Source: Company data, UBS estimates
Figure 4: ChipMOS's historical PE range
Source: LSEG
| 2025 | 2026E | 2027E | 2028E | 2029E |
|---|---|---|---|---|
| $23,933 | $30,223 | $35,178 | $38,868 | $42,060 |
| 5.5% $2,592 10.8% $6,243 26.1% ($555) $587 $92 | 26.3% $5,146 17.0% $8,391 | 16.4% $7,121 20.2% $10,317 $431 $795 | 10.5% $8,260 21.3% $11,292 $458 $944 | 8.2% $9,105 21.6% $11,993 |
| -65.1% | 27.8% $431 $3,440 | 29.3% | 29.1% $6,092 | 28.5% $436 $6,833 $1,059 15.5% $5,774 |
| 487.0% | ||||
| 15.7% $495 | $534 15.5% $2,906 | $5,131 15.5% $4,336 | 15.5% $5,148 | |
| 18.7% | 12.1% | |||
| $0.69 | $4.15 | $6.19 | $8.25 | |
| 49.2% | ||||
| $7.35 |
Figure 5: ChipMOS's FINI ownership
Source: TEJ
| 2025 | 2026E | 2026E | 2026E | 2027E | 2027E | 2027E |
|---|---|---|---|---|---|---|
| Actual | UBSe | UBSe prior | LSEG | UBSe | UBSe prior | LSEG |
| 23,933 | 30,223 | 30,214 | 29,310 | 35,178 | 32,374 | 32,494 |
| 5.5% | 26.3% | 26.2% | 22.5% | 16.4% | 7.1% | 10.9% |
| 2,592 | 5,146 | 5,063 | 5,103 | 7,121 | 6,452 | 6,659 |
| 10.8% | 17.0% | 16.8% | 17.4% | 20.2% | 19.9% | 20.5% |
| 1,143 | 3,253 | 3,191 | 3,185 | 5,026 | 4,435 | 4,565 |
| 4.8% | 10.8% | 10.6% | 10.9% | 14.3% | 13.7% | 14.0% |
| -555 | 431 | 487 | 300 | 431 | 487 | 247 |
| 587 | 3,440 | 3,348 | 3,486 | 5,131 | 4,567 | 4,812 |
| 92 | 534 | 519 | 561 | 795 | 708 | 786 |
| -16% | -16% | -16% | -16% | -16% | -16% | -16% |
| 495 | 2,906 | 2,828 | 2,925 | 4,336 | 3,859 | 4,025 |
| 0.69 | 4.15 | 3.98 | 4.13 | 6.19 | 5.43 | 5.64 |
Figure 6: ChipMOS is trading at 18.4x 2027E PE, below those of peers
| Company name | Ticker | Market Cap | Share Price | EPS (LC) | EPS growth (%) | EPS growth (%) | P/E (x) | P/E (x) | P/BV (x) | P/BV (x) | ROE (%) | ROE (%) | |
|---|---|---|---|---|---|---|---|---|---|---|---|---|---|
| (US$mn) | (LC) | 2026E | 2027E | 2026E | 2027E | 2026E | 2027E | 2026E | 2027E | 2026E | 2027E | ||
| ChipMOS Technologies Inc | 8150.TW | 2,533 | 114.0 | 4.15 | 6.19 | 498.5 | 49.2 | 27.5 | 18.4 | 3.1 | 2.7 | 11.1 | 14.9 |
| OSAT peers | |||||||||||||
| Powertech Technology Inc | 6239.TW | 7,416 | 314.0 | 12.48 | 18.16 | 74.2 | 45.4 | 25.2 | 17.3 | 3.7 | 3.2 | 14.8 | 18.8 |
| ASE Technology Holding Co Ltd | 3711.TW | 94,790 | 683.0 | 16.86 | 24.63 | 93.8 | 46.1 | 40.5 | 27.7 | 7.7 | 6.7 | 19.4 | 25.6 |
| King Yuan Electronics Co Ltd | 2449.TW | 11,679 | 307.0 | 9.74 | 15.29 | 8.7 | 57.0 | 31.5 | 20.1 | 6.3 | 5.4 | 21.2 | 27.6 |
| Chipbond Technology Corp | 6147.TWO | 4,737 | 204.5 | 5.10 | 7.06 | 15.1 | 38.3 | 40.1 | 29.0 | 3.0 | 2.9 | 7.9 | 10.4 |
| Amkor Technology Inc | AMKR.O | 17,401 | 70.2 | 2.05 | 2.29 | 62.7 | 12.1 | 34.3 | 30.6 | 3.5 | 3.1 | 11.4 | 11.9 |
| Nepes Corp | 033640.KQ | 331 | 21,400.0 | 230.00 | 1,087.00 | (32.2) | 372.6 | 93.0 | 19.7 | 3.8 | 3.2 | 4.2 | 17.7 |
| Average | 44.1 | 24.1 | 4.7 | 4.1 | 13.2 | 18.7 |
Source: Company data, LSEG, UBS estimates. Note: Data as of 15 July 2026 for Powertech, ASE, King Yuan, Chipbond, and Nepes. Data as of 14 July 2026 for Amkor.
ChipMOS Technologies - 8150.TW Price
Upside/Downside Spectrum
Upside/Downside Spectrum
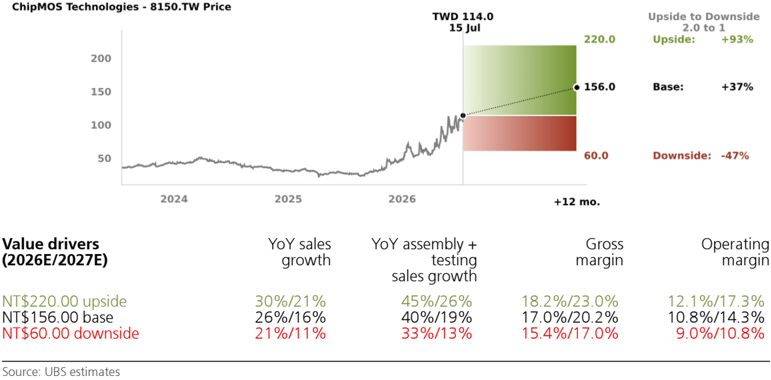
Risk to the current share price is skewed to the upside (2:1)
ChipMOS is trading at NT$114 (as of 15 July 2026).
UPSIDE (NT$220): Our upside scenario factors in a stronger memory upcycle and ChipMOS further raising its ASP for excess profitability, along with a better end-demand recovery for the driver IC business, as well as faster penetration into bumping for LPO/ optical components. Sales growth would be 30%/21% in 2026/2027, while GM would expand to 18.2%/23.0%, 1.2-2.8ppt above our base case, resulting in OPM of 12.1%/17.3%. Our upside valuation of NT$220 assumes 25x average 2027-28E PE.
BASE (NT$156): Our base case reflects our expectation of a memory upcycle and an improving ASP outlook for the memory/logic and driver IC businesses. We expect sales growth of 26%/16% in 2026/2027, as GM recovers to 17.0%/20.2% from 10.8% in 2025. That leads to OPM of 10.8%/14.3%, up from 4.8% in 2025. Our price target is NT $156, based on 23x average 2027-28E PE vs. a historical normalized 5-27x range, in line with the average PE of memory and driver IC OSAT peers.
DOWNSIDE (NT$60): Our downside scenario factors in a weaker end-demand environment, resulting in lower utilisation and a softer ASP environment. We assume 2026/2027 sales growth of 21%/11% YoY, as GM falls to 15.4%/17.0% on smaller revenue scale. This, along with negative operating leverage, could lead to OPM of 9.0%/10.8%. Our downside valuation of NT$60 assumes 13x average 2027-28E PE.
TWD 114.0
15 Jul
220.0
• 156.0
Upside to Downside
Upside:
2.0 to 1
+93%
Base:
+37%
ChipMOS is trading at NT$114 (as of 15 July 2026).
ChipMOS Technologies (8150.TW)
| Income Statement (NT$m) | 12/23 | 12/24 | 12/25 | 12/26E | %ch | 12/27E | %ch | 12/28E | 12/29E | 12/30E |
|---|---|---|---|---|---|---|---|---|---|---|
| Revenues | 21,356 | 22,696 | 23,933 | 30,223 | 26.3 | 35,178 | 16.4 | 38,868 | 42,060 | 45,439 |
| Gross profit | 3,549 | 2,944 | 2,592 | 5,146 | 98.5 | 7,121 | 38.4 | 8,260 | 9,105 | 10,022 |
| EBITDA (UBS) | 6,688 | 6,130 | 6,243 | 8,391 | 34.4 | 10,317 | 23.0 | 11,292 | 11,993 | 12,765 |
| Depreciation & amortisation | (4,779) | (4,856) | (5,101) | (5,137) | -0.7 | (5,291) | -3.0 | (5,291) | (5,291) | (5,291) |
| EBIT (UBS) | 1,908 | 1,274 | 1,143 | 3,253 | 184.7 | 5,026 | 54.5 | 6,001 | 6,702 | 7,474 |
| Associates & investment income | 220 | 3 | (143) | 19 | - | 0 | - | 0 | 0 | 0 |
| Other non-operating income | 211 | 444 | (364) | 271 | - | 220 | -18.7 | 220 | 220 | 295 |
| Net interest | (71) | (74) | (49) | (102) | -109.8 | (115) | -12.0 | (128) | (89) | (38) |
| Exceptionals (incl goodwill) | 0 | 0 | 0 | 0 | - | 0 | - | 0 | 0 | 0 |
| Pre-tax profit | 2,268 | 1,647 | 587 | 3,440 | NM | 5,131 | 49.2 | 6,092 | 6,833 | 7,731 |
| Tax | (375) | (227) | (92) | (534) | NM | (795) | -49.0 | (944) | (1,059) | (1,187) |
| Profit after tax | 1,893 | 1,420 | 495 | 2,906 | NM | 4,336 | 49.2 | 5,148 | 5,774 | 6,544 |
| Preference dividends | 0 | 0 | 0 | 0 | - | 0 | - | 0 | 0 | 0 |
| Minorities | 0 | 0 | - | 0 | - | 0 | 0 | 0 | ||
| Extraordinary items | 0 | 0 | 0 0 | 0 0 | - | 0 | - | 0 | 0 | 0 |
| Net earnings (local GAAP) | 1,893 | 1,420 | 495 | 2,906 | NM | 4,336 | 49.2 | 5,148 | 5,774 | 6,544 |
| Net earnings (UBS) | 1,893 | 1,420 | 49.2 | |||||||
| Tax rate (%) | 16.5 | 495 | 2,906 15.5 | NM -1.1 | 4,336 | 5,148 | 5,774 | 6,544 | ||
| 12/23 | 13.8 | 15.7 | 12/26E | %ch | 15.5 | -0.1 | 15.5 | 15.5 | 15.4 | |
| Per Share (NT$) EPS (UBS, diluted) | 2.60 | 12/24 1.95 | 12/25 0.69 | 4.15 | NM | 12/27E 6.19 | %ch 49.2 | 12/28E 7.35 | 12/29E 8.25 | 12/30E 9.35 |
| EPS (local GAAP, diluted) | 2.60 | 1.95 | 0.69 | 4.15 | NM | 6.19 | 49.2 | 7.35 | 8.25 | 9.35 |
| EPS (UBS, basic) | 2.60 | 0.69 | 4.15 | 6.19 | 7.35 | |||||
| DPS (net) (NT$) | 2.30 | 1.95 | 1.23 | 1.25 | NM | 2.08 | 49.2 | 3.10 | 8.25 | 9.35 |
| Cash EPS (UBS, diluted) 1 | 9.18 | 1.80 8.63 | 7.84 | 11.49 | 1.0 46.6 | 13.75 | 66.5 19.7 | 14.91 | 3.68 15.81 | 4.12 16.91 |
| Book value per share | 34.17 | 34.48 | 34.08 | 37.34 | 9.6 | 41.46 | 11.0 | 45.71 | 50.28 | 55.40 |
| Average shares (diluted) | 727 | 727 | 714 | 700 | -1.9 | 700 | 0.0 | 700 | 700 | 700 |
| Balance Sheet (NT$m) | 12/23 | 12/24 | 12/25 | 12/26E | %ch | 12/27E | %ch | 12/28E | 12/29E | 12/30E |
| Cash and equivalents | 12,354 | 15,219 | 14,859 | 11,521 | -22.5 | 9,715 | -15.7 | 11,141 | 13,603 | 16,487 |
| Other current assets Total current assets | 12,807 | 8,424 | 10,288 | 12,735 24,256 | 23.8 | 15,147 | 18.9 | 15,854 26,995 | 17,224 30,827 | 18,549 |
| Net tangible fixed assets | 25,161 19,140 | 23,644 19,997 | 25,147 18,691 | 19,631 | -3.5 5.0 | 24,862 22,140 | 2.5 12.8 | 23,049 | 22,558 | 35,036 22,067 |
| Net intangible fixed assets | 0 | 0 | - | 0 | - | 0 | 0 | 0 | ||
| Investments / other assets | 1,860 | 0 | 0 | 2,470 | 63.2 | 2,470 | 0.0 | 2,470 | 2,470 | 2,470 |
| Total assets | 46,160 | 1,740 45,380 | 1,514 45,352 | 46,357 | 2.2 | 49,472 | 6.7 | 52,514 | 55,856 | 59,573 |
| Trade payables & other ST liabilities | 5,090 | 5,008 | 4,864 | 4,208 | 4,440 | 4,501 | 4,643 | 4,779 | ||
| Short term debt | 2,264 | 5,776 | -13.5 3.1 | 5,776 | 5.5 | 5,776 | 5,776 | 5,776 | ||
| Total current liabilities | 7,353 | 3,665 | 5,603 10,467 | 9,984 | -4.6 | 10,216 | 0.0 2.3 | 10,277 | 10,419 | 10,555 |
| Long term debt | 12,648 | 8,673 10,433 | 9,868 | 9,181 | -7.0 | 9,181 | 0.0 | 9,181 | 9,181 | 9,181 |
| Other long term liabilities | 1,306 | 1,200 | 1,057 | 4.7 | 1,057 | 0.0 | 1,057 | 1,057 | 1,057 | |
| Preferred shares | 0 | 1,009 | 0 | - | 0 | - | 0 | 0 | 0 | |
| Total liabilities (incl pref shares) | 21,307 | 0 20,306 | 0 21,344 | 20,454 | 1.1 | 20,515 | 20,657 | 20,792 | ||
| Common s/h equity | 24,854 | 25,074 | 24,008 | 20,221 | -5.3 8.9 | 29,018 | 11.0 | 31,999 | ||
| Minority interests | 0 | 0 45,380 | 0 | 26,136 0 | - | 0 | - | 0 | 35,198 0 | 38,781 |
| Total liabilities & equity | 46,160 | 45,352 | 46,357 | 2.2 | 49,472 | 6.7 | 52,514 | 55,856 | 0 59,573 | |
| Cash Flow (NT$m) | 12/23 | 12/24 | 12/25 | 12/26E | %ch | 12/27E | %ch | 12/28E | 12/29E | 12/30E |
| Net income (before pref divs) Depreciation & amortisation | 1,893 4,779 | 1,420 4,856 | 495 5,101 | 2,906 5,137 | NM | 4,336 5,291 | 49.2 3.0 | 5,148 5,291 | 5,774 5,291 | 6,544 |
| Net change in working capital | (78) | 105 | (1,225) | 0.7 | (2,004) | 8.5 | (591) | (1,129) | 5,291 | |
| Other operating | 13 | (440) | (374) | (2,191) (17) | -78.9 95.3 | (176) | NM | (55) | (100) | (1,093) (97) |
| Operating cash | 6,607 | 5,941 | 3,996 | 46.0 | 7,447 | 27.6 | 9,794 | 9,836 | ||
| flow Tangible capital | (2,990) | (612) | (3,601) | 5,835 | (7,800) | -13.5 | (6,200) | (4,800) | 10,645 | |
| expenditure Intangible capital expenditure | (6,874) 0 | -90.9 | 0 | 0 | (4,800) | |||||
| 0 | 0 | 0 | - | 0 | - | 0 | 0 | |||
| Net (acquisitions) & disposals Other investing | 0 (100) | 0 | 0 (138) | 0 (862) | - NM | 0 | - | 0 0 | 0 0 | 0 0 |
| Investing cash | (3,090) | (3) | (3,739) | (4,800) | ||||||
| flow | (615) | (7,735) | -106.9 | (7,800) | - -0.8 | (6,200) | (4,800) | |||
| Equity dividends paid | (1,673) 0 | (1,309) 0 | (873) | (873) | 0.0 | (1,453) 0 | -66.5 - | (2,168) 0 | (2,574) 0 | (2,887) 0 |
| Share issues / (buybacks) | 0 | - | ||||||||
| Other financing | (294) | (321) | (815) (272) | (52) | 81.0 | 0 | - | 0 | 0 | 0 0 |
| Change in debt & pref shares | 907 | (846) (2,475) | 1,353 (607) | (518) | - -137.5 | 0 (1,453) | - -0.8 | 0 (2,168) | 0 (2,574) | (2,887) |
| Financing cash flow Cash flow inc/(dec) in | (1,059) 2,458 | 2,850 | (350) | (1,442) (3,343) | NM | 1,426 | 2,462 | 2,959 | ||
| cash FX / non cash items | (10) | 5 | - | (1,806) 0 | 46.0 | 0 | (75) | |||
| Balance sheet inc/(dec) in cash | (129) 2,329 | 15 2,865 | (360) | (3,338) | NM | (1,806) | - | 0 | ||
| 1,426 | ||||||||||
| 45.9 | 2,462 | 2,884 |
Source: Company accounts, UBS estimates. (UBS) metrics use reported figures which have been adjusted by UBS analysts. 1 Cash EPS (UBS, diluted) is calculated using UBS net income adding back depreciation and amortization.
ChipMOS Technologies (8150.TW)
| Valuation (x) | 12/23 | 12/24 | 12/25 | 12/26E | 12/27E | 12/28E | 12/29E | 12/30E |
|---|---|---|---|---|---|---|---|---|
| P/E (local GAAP, diluted) | 14.6 | 20.8 | 44.9 | 27.5 | 18.4 | 15.5 | 13.8 | 12.2 |
| P/E (UBS, diluted) | 14.6 | 20.8 | 44.9 | 27.5 | 18.4 | 15.5 | 13.8 | 12.2 |
| P/CEPS | 4.1 | 4.7 | 4.0 | 9.9 | 8.3 | 7.6 | 7.2 | 6.7 |
| Equity FCF (UBS) yield% | 13.1 | 18.1 | 1.8 | (1.3) | (0.4) | 4.5 | 6.3 | 7.3 |
| Dividend yield (net)% | 6.0 | 4.4 | 4.0 | 1.1 | 1.8 | 2.7 | 3.2 | 3.6 |
| P/BV | 1.1 | 1.2 | 0.9 | 3.1 | 2.7 | 2.5 | 2.3 | 2.1 |
| EV/revenues (core) | 1.1 | 1.3 | 0.9 | 2.7 | 2.4 | 2.2 | 2.0 | 1.8 |
| EV/EBITDA (UBS core) | 3.6 | 4.9 | 3.5 | 9.8 | 8.2 | 7.5 | 6.9 | 6.3 |
| EV/EBIT (core) | 12.8 | 23.5 | 19.3 | 25.2 | 16.8 | 14.1 | 12.3 | 10.7 |
| EV/OpFCF (core) | 4.0 | 5.7 | 4.0 | 11.7 | 9.6 | 8.4 | 7.5 | 7.2 |
| EV/op. invested capital | 1.2 | 1.2 | 0.9 | 3.1 | 2.7 | 2.4 | 2.3 | 2.2 |
| Enterprise value (NT$m) | 12/23 | 12/24 | 12/25 | 12/26E | 12/27E | 12/28E | 12/29E | 12/30E |
| Market cap. | 27,653 | 29,491 | 22,521 | 80,316 | 80,316 | 80,316 | 80,316 | 80,316 |
| Net debt (cash) | (2,972) | 718 | (255) | 2,024 | 4,339 | 4,529 | 2,585 | (88) |
| Buy out of minorities | 0 | 0 | 0 | 0 | 0 | 0 | 0 | 0 |
| Pension provisions/other | 0 | 0 | 0 | 0 | 0 | 0 | 0 | 0 |
| Total enterprise value | 24,681 | 30,209 | 22,267 | 82,339 | 84,654 | 84,845 | 82,901 | 80,227 |
| Non core assets | (291) | (320) | (190) | (215) | (215) | (215) | (215) | (215) |
| Core enterprise value | 24,391 | 29,889 | 22,077 | 82,125 | 84,440 | 84,630 | 82,686 | 80,013 |
| Growth (%) | 12/23 | 12/24 | 12/25 | 12/26E | 12/27E | 12/28E | 12/29E | 12/30E |
| Revenue | (9.2) | 6.3 | 5.5 | 26.3 | 16.4 | 10.5 | 8.2 | 8.0 |
| EBITDA (UBS) | (16.1) | (8.3) | 1.8 | 34.4 | 23.0 | 9.5 | 6.2 | 6.4 |
| EBIT (UBS) | (40.7) | (33.2) | (10.3) | 184.7 | 54.5 | 19.4 | 11.7 | 11.5 |
| EPS (UBS, diluted) | (43.8) | (25.0) | (64.5) | NM | 49.2 | 18.7 | 12.1 | 13.3 |
| Net DPS | (46.5) | (21.7) | (31.4) | 1.0 | 66.5 | 49.2 | 18.7 | 12.1 |
| Margins & Profitability (%) | 12/23 | 12/24 | 12/25 | 12/26E | 12/27E | 12/28E | 12/29E | 12/30E |
| Gross profit margin | 16.6 | 13.0 | 10.8 | 17.0 | 20.2 | 21.3 | 21.6 | 22.1 |
| EBITDA margin | 31.3 | 27.0 | 26.1 | 27.8 | 29.3 | 29.1 | 28.5 | 28.1 |
| EBIT (UBS) margin | 8.9 | 5.6 | 4.8 | 10.8 | 14.3 | 15.4 | 15.9 | 16.4 |
| Net earnings (UBS) margin | 8.9 | 6.3 | 2.1 | 9.6 | 12.3 | 13.2 | 13.7 | 14.4 |
| ROIC (EBIT) | 9.8 | 5.0 | 4.8 | 12.1 | 15.9 | 17.2 | 18.6 | 20.4 |
| ROIC post tax | 8.0 | 4.3 | 4.2 | 10.2 | 13.4 | 14.6 | 15.7 | 17.2 |
| ROE (UBS) | 7.6 | 5.7 | 2.0 | 11.6 | 15.7 | 16.9 | 17.2 | 17.7 |
| Capital structure & Coverage (x) | 12/23 | 12/24 | 12/25 | 12/26E | 12/27E | 12/28E | 12/29E | 12/30E |
| Net debt / EBITDA | 0.4 | (0.2) | 0.1 | 0.4 | 0.5 | 0.3 | 0.1 | (0.1) |
| Net debt / total equity% | 10.3 | (4.5) | 2.5 | 13.1 | 18.1 | 11.9 | 3.8 | (3.9) |
| Net debt / (net debt + total equity)% | 9.3 | (4.7) | 2.5 | 11.6 | 15.3 | 10.7 | 3.7 | (4.1) |
| Net debt/EV% | (12.0) | 2.4 | (1.1) | 2.5 | 5.1 | 5.3 | 3.1 | (0.1) |
| Capex / depreciation% | 62.6 | 12.6 | 70.6 | 133.8 | 147.4 | 117.2 | 90.7 | 90.7 |
| Capex / revenue% | 14.0 | 2.7 | 15.0 | 22.7 | 22.2 | 16.0 | 11.4 | 10.6 |
| EBIT / net interest | 30.1 | 17.4 | 20.5 | 31.9 | 43.8 | 46.8 | NM | NM |
| Dividend cover (UBS) | 1.1 | 1.1 | 0.6 | 3.3 | 3.0 | 2.4 | 2.2 | 2.3 |
| Div. payout ratio (UBS)% | 88.3 | 92.2 | 178.0 | 30.0 | 33.5 | 42.1 | 44.6 | 44.1 |
| Revenues by division (NT$m) | 12/23 | 12/24 | 12/25 | 12/26E | 12/27E | 12/28E | 12/29E | 12/30E |
| Others | 21,356 | 22,696 | 30,223 | 35,178 | ||||
| 23,933 | 38,868 | 42,060 | 45,439 | |||||
| Total | 21,356 | 22,696 | 23,933 | 30,223 | 35,178 | 38,868 | 42,060 | 45,439 |
| EBIT (UBS) by division (NT$m) | 12/23 | 12/24 | 12/25 | 12/26E | 12/27E | 12/28E | 12/29E | 12/30E |
| Others | 1,908 | 1,274 | 1,143 | 3,253 | 5,026 | 6,001 | 6,702 | 7,474 |
| 1,908 | 1,274 | 1,143 | 5,026 | 6,001 | 6,702 | 7,474 | ||
| Total | 3,253 |
Source: Company accounts, UBS estimates. (UBS) metrics use reported figures which have been adjusted by UBS analysts.
Forecast returns
| Forecast price appreciation | 36.8% |
|---|---|
| Forecast dividend yield | 1.1% |
| Forecast stock return | 37.9% |
| Market return assumption | 6.3% |
| Forecast excess return | 31.7% |
Company Description
ChipMOS is a semiconductor back-end supplier with 45-50% of its sales from display driver IC (~40% from TV and 40% from smartphone and IT and 20% from automotive), 35-40% from memory (~40% DRAM, ~40% from specialty flash and ~20% from mainstream NAND) and 10-15% from logic (TV SoC) and mixed signal IC (MEMS, PMIC).
Valuation Method and Risk Statement
We have a Buy rating and a NT$156 price target, based on 23x average 2027-28E PE (vs. its normalized 5-27x PE range). Our target multiple is in line with the average of memory and driver IC OSAT peers.
Downside risks include a weaker-than-expected tech end-market demand recovery, growing China competition, failure to diversify into the SiPh/optical component bumping business and a slower ramp of its logic testing business.
Quantitative Research Review
UBS Global Research publishes a quantitative assessment of its analysts' responses to certain questions about the likelihood of an occurrence of a number of short term factors in a product known as the 'Quantitative Research Review'. The views for this month can be found below. Views contained in this assessment on a particular stock reflect only the views on those short term factors which are a different timeframe to the 12-month timeframe reflected in any equity rating set out in this note. For previous responses please make reference to (i) previous UBS Global Research reports; and (ii) where no applicable research report was published that month, the Quantitative Research Review which can be found at https://neo.ubs.com/quantitative, or contact your UBS sales representative for access to the report or the Quantitative Research Team on ubs-quant-answers@ubs.com. A consolidated report which contains all responses is also available and again you should contact your UBS sales representative for details and pricing or the Quantitative Research Team on the email above.
ChipMOS Technologies
| Question | Response |
|---|---|
| 1. Is the industry structure facing the firm likely to improve or deteriorate over the next six months? Rate on a scale of 1-5 (1 = getting worse, 3 = no change, 5 = getting better, N/A = no view) | 4 |
| 2. Is the regulatory/government environment facing the firm likely to improve or deteriorate over the next six months? Rate on a scale of 1-5 (1 = getting tougher 3 = no change, 5 = getting better, N/A = no view) | 3 |
| 3. Over the last 3-6 months in broad terms have things been improving/no change/getting worse for this stock? Rate on a scale of 1-5 (1 = getting a lot worse, 3 = not much change, 5 = getting a lot better, N/A = no view) | 4 |
| 4. Relative to the current CONSENSUS EPS forecast, is the next company EPS update likely to lead to: (1 = negative surprise vs consensus, 3 = in-line with consensus, 5 = positive surprise vs consensus expectations, N/A = no view) | 4 |
| 5. What's driving the difference? | |
| 6. Relative to YOUR current earnings forecast, is there relatively greater risk at the next earnings result of:(1 = downside skew risk to earnings, 3 = equal upside or downside risk to earnings, 5 = upside skew risk to earnings, N/A = no view) | 3 |
| 7. What's driving the difference? | |
| 8. Is there an upcoming catalyst for the company over the next three months? | No Catalyst |
| 9. Is there an actual or approximate date for the catalyst? | |
| 10. Is the catalyst date an actual or approximate date? | |
| 11. What is the catalyst? |
Required Disclosures
This document has been prepared by UBS Securities Pte. Ltd., Taipei Branch, an affiliate of UBS AG. UBS AG, its subsidiaries, branches and affiliates, including former Credit Suisse AG and its subsidiaries, branches and affiliates are referred to herein as "UBS".
For information on the ways in which UBS manages conflicts and maintains independence of its UBS Global Research product; historical performance information; certain additional disclosures concerning UBS Global Research recommendations; and terms and conditions for certain third party data used in research report, please visit https://www.ubs.com/disclosures. Unless otherwise indicated, information and data in this report are based on company disclosures including but not limited to annual, interim, quarterly reports and other company announcements. The figures contained in performance charts refer to the past; past performance is not a reliable indicator of future results. Additional information will be made available upon request. UBS Securities Co. Limited is licensed to conduct securities investment consultancy businesses by the China Securities Regulatory Commission. UBS acts or may act as principal in the debt securities (or in related derivatives) that may be the subject of this report. This recommendation was finalized on: 15 July 2026 03:30 PM GMT. UBS has designated certain UBS Global Research department members as Derivatives Research Analysts where those department members publish research principally on the analysis of the price or market for a derivative, and provide information reasonably sufficient upon which to base a decision to enter into a derivatives transaction. Where Derivatives Research Analysts coauthor research reports with Equity Research Analysts or Economists, the Derivatives Research Analyst is responsible for the derivatives investment views, forecasts, and/or recommendations. Quantitative Research Review: UBS Global Research publishes a quantitative assessment of its analysts' responses to certain questions about the likelihood of an occurrence of a number of short term factors in a product known as the 'Quantitative Research Review'. Views contained in this assessment on a particular stock reflect only the views on those short term factors which are a different timeframe to the 12-month timeframe reflected in any equity rating set out in this note. For the latest responses, please see the Quantitative Research Review Addendum at the back of this report, where applicable. For previous responses please make reference to (i) previous UBS Global Research reports; and (ii) where no applicable research report was published that month, the Quantitative Research Review which can be found at https://neo.ubs.com/ quantitative, or contact your UBS sales representative for access to the report or the Quantitative Research Team on ubs-quantanswers@ubs.com. A consolidated report which contains all responses is also available and again you should contact your UBS sales representative for details and pricing or the Quantitative Research team on the email above.