PDF 原檔:報告_MS_正新2105_20260720_original.pdf
圖片清單(已驗證 2026-07-22)
| 檔名 | size | 分類 | 親眼所見內容 |
|---|---|---|---|
報告_MS_正新2105_20260720_001.png |
66KB | 裝飾·logo·banner | 「Asia Summer School 2026」廣告 banner(泳池背景) |
報告_MS_正新2105_20260720_003.png |
39KB | 真資料圖 | MS Estimates vs. Consensus 圖:FY Dec 2026e Sales/Revenue NT$91,556mn、EBIT NT$6,409mn、EPS NT$1.40(藍菱形為 MS 估計,無足夠券商供應 consensus 數據) |
報告_MS_正新2105_20260720_004.png |
55KB | 真資料圖 | Risk Reward 歷史圖:股價走勢+評等區間(U/I→O/I→E/I→U/I)與對應目標價階梯(30→50→55→48→29.5),時間軸 2023/07-2026/07 |
002.png(23KB)<40KB 未 Read,預設 logo。
原始內容
M July 20, 2026 10:51 PM GMT
Cheng Shin Rubber | Asia Pacific
Risk Reward Update
What's Changed
| Cheng Shin Rubber (2105.TW) | From | To |
|---|---|---|
| Price Target | NT$29.50 | NT$28.00 |
| Bull Case | NT$60.00 | NT$55.00 |
| Base Case | NT$29.50 | NT$28.00 |
| Bear Case | NT$20.00 | NT$19.00 |
| Updated Components | ||
| EPS | ||
| Investment Thesis | ||
| Bull Base Bear Scenarios | ||
| Risks to Price Target / Rating |
Risk Reward for Cheng Shin Rubber (2105.TW) has been updated
Reason for change
We updated latest financials while lowering our 2026-27 earnings forecasts mainly to reflect rising material costs that may weigh on near-term GpM. We now forecast 2Q-4Q26 GpM to be close to 20-21% before crude oil prices normalizing. The assumptions broadly align with previous price hikes back to 2021/22.
That said, disciplined opex management (~15% of revenue) should help sustain operating margins going forward and we keep the same revenue growth assumptions of largely flat.
We continue to use a residual income model to derive our price target and cut our base, bull and bear case valuations by 5-8% to reflect updated 2026-28 forecasts and latest lower beta as a result of limited share price movement. Our new price target of NT$28 implies dividend yield of about 4-5% on a payout ratio of 80-100%.
Morgan Stanley Asia Limited+
Tim Hsiao
Equity Analyst
Tim.Hsiao@morganstanley.com
Update
+852 2848-1982

Cheng Shin Rubber (2105.TW, 2105 TT)
Taiwan Autos & Auto Parts | Taiwan
Stock Rating
Underweight
Industry View
In-Line
Price target
NT$28.00
Shr price, close (Jul 20, 2026)
NT$33.20
52-Week Range
NT$42.75-28.10
| Fiscal Year Ending | 12/25 | 12/26e | 12/27e | 12/28e |
|---|---|---|---|---|
| EPS (NT$)** | 1.5 | 1.4 | 1.44 | 1.38 |
| Prior EPS (NT$)** | 1.55 | 1.6 | 1.61 | - |
Unless otherwise noted, all metrics are based on Morgan Stanley ModelWare framework
- ** = Based on consensus methodology
- e = Morgan Stanley Research estimates
Morgan Stanley does and seeks to do business with companies covered in Morgan Stanley Research. As a result, investors should be aware that the firm may have a conflict of interest that could affect the objectivity of Morgan Stanley Research. Investors should consider Morgan Stanley Research as only a single factor in making their investment decision.
For analyst certification and other important disclosures, refer to the Disclosure Section, located at the end of this report.
+= Analysts employed by non-U.S. affiliates are not registered with FINRA, may not be associated persons of the member and may not be subject to FINRA restrictions on communications with a subject company, public appearances
- and trading securities held by a research analyst account.
M
Risk Reward - Cheng Shin Rubber (2105.TW) Risk Reward - Cheng Shin Rubber (2105.TW)
Intense competition continues to weigh on earnings momentum
NT$28.00 PRICE TARGET
Base case, derived from residual income model. Key assumptions include a 4.9% cost of equity, a 1% medium-term growth rate, and flat growth thereafter.
RISK REWARD CHART
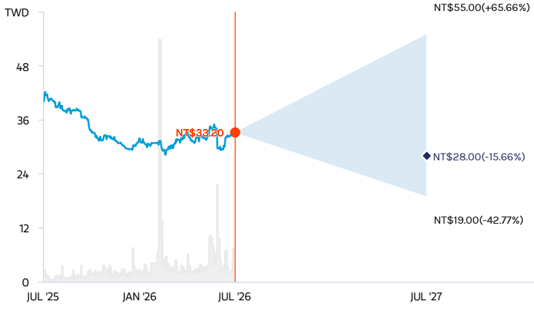
Key:
- Historical Stock Performance
Current Stock Price
Source: Refinitiv, Morgan Stanley Research
BULL CASE
30x 2026e EPS
Stronger-than-expected demand from China and emerging markets, along with higher dividend payout driven by excess free cash flow or potential capacity consolidation.
NT$55.00
Price Target
BASE CASE
20x 2026e EPS
Earnings growth momentum remains muted given revenue pressure from competition while continuous dividend payouts help support the share price.
NT$28.00
UNDERWEIGHT THESIS
- Competitive pressure in China's tire market is likely to persist, and it should take time for this segment to return to a sustainable growth trajectory.
- Non-China growth will likely require time and scale, as additional volume is needed to bridge the revenue gap left by weaker PV and truck tire sales, a high hurdle in the near term.
- The share price implies a 24x 2026e P/E, higher than the 5-year average and with limited fundamental drivers for re-rating.
Risk Reward Themes
| Pricing Power: | Negative |
|---|---|
| Secular Growth: | Negative |
| Self-help: | Positive |
View descriptions of Risk Rewards Themes here
BEAR CASE
15x 2026e EPS
Weaker demand in China, the EU, and emerging markets, while raw material costs continue to rise. Potential downside from tariff burdens or anti-dumping actions.
NT$19.00
M
Risk Reward - Cheng Shin Rubber (2105.TW)
KEY EARNINGS INPUTS
| Drivers | Dec 2025 | Dec 2026e | Dec 2027e | Dec 2028e |
|---|---|---|---|---|
| Sales volume growth (%) | (1) | 1 | 1 | 1 |
| ASP growth (%) | (4) | (1) | (1) | (1) |
| Operating expense ratio (%) | 14.8 | 15.0 | 15.0 | 15.0 |
| Inventory days | 91 | 91 | 91 | 91 |
INVESTMENT DRIVERS
- Growth in emerging markets and broader adoption across additional car models through EU OEM relationships.
- Lower raw material prices.
- Higher dividend payout ratio.
GLOBAL REVENUE EXPOSURE
Source: Morgan Stanley Research Estimate View explanation of regional hierarchies here
MS ALPHA MODELS
2/5 MOST
3 Month Horizon
Source: Refinitiv, FactSet, Morgan Stanley Research; 1 is the highest favored Quintile and 5 is the least favored Quintile
RISKS TO PT/RATING
RISKS TO UPSIDE
- Faster-than-expected increase in demand in China.
- Lower-than-expected raw material prices.
- Stronger-than-expected replacement tire demand globally.
- Favorable CNY/USD rate supporting GpM
RISKS TO DOWNSIDE
- Slower-than-expected increase in demand in China.
- Higher-than-expected raw material prices.
- Weaker-than-expected replacement tire demand globally.
OWNERSHIP POSITIONING
Inst. Owners, % Active
19.3%
Source: Refinitiv, Morgan Stanley Research
MS ESTIMATES VS. CONSENSUS
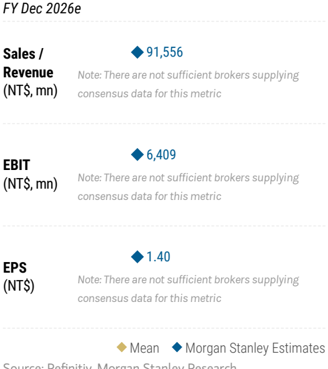
M
Risk Reward Reference links
- View explanation of Options Probabilities methodology -Options_Probabilities_Exhibit_Link.pdf
- View descriptions of Risk Rewards Themes - RR_Themes_Exhibit_Link.pdf
-
View explanation of regional hierarchies - GEG_Exhibit_Link.pdf
-
View explanation of Theme/Exposure methodology -
-
ESG_Sustainable_Solutions_External_Link.pdf
-
View explanation of HERS methodology - ESG_HERS_External_Link.pdf
M
Disclosure Section
The information and opinions in Morgan Stanley Research were prepared or are disseminated by Morgan Stanley Asia Limited (which accepts the responsibility for its contents) and/or Morgan Stanley Asia (Singapore) Pte. (Registration number 199206298Z) and/or Morgan Stanley Asia (Singapore) Securities Pte Ltd (Registration number 200008434H), regulated by the Monetary Authority of Singapore (which accepts legal responsibility for its contents and should be contacted with respect to any matters arising from, or in connection with, Morgan Stanley Research), and/or Morgan Stanley Taiwan Limited and/or Morgan Stanley & Co International plc, Seoul Branch, and/or Morgan Stanley Australia Limited (A.B.N. 67 003 734 576, holder of Australian financial services license No. 233742, which accepts responsibility for its contents), and/or Morgan Stanley Wealth Management Australia Pty Ltd (A.B.N. 19 009 145 555, holder of Australian financial services license No. 240813, which accepts responsibility for its contents), and/or Morgan Stanley India Company Private Limited having Corporate Identification No (CIN) U22990MH1998PTC115305, regulated by the Securities and Exchange Board of India ('SEBI') and holder of licenses as a Research Analyst (SEBI Registration No. INH000001105); Stock Broker (SEBI Stock Broker Registration No. INZ000244438), Merchant Banker (SEBI Registration No. INM000011203), and depository participant with National Securities Depository Limited (SEBI Registration No. IN-DP-NSDL-567-2021) having registered office at Altimus, Level 39 & 40, Pandurang Budhkar Marg, Worli, Mumbai 400018, India; Telephone no. +91-22-61181000; Compliance Officer Details: Mr. Tejarshi Hardas, Tel. No.: +91-22-61181000 or Email: tejarshi.hardas@morganstanley.com; Grievance officer details: Mr. Tejarshi Hardas, Tel. No.: +91-22-61181000 or Email: msic-compliance@morganstanley.com which accepts the responsibility for its contents and should be contacted with respect to any matters arising from, or in connection with, Morgan Stanley Research, and their affiliates (collectively, "Morgan Stanley"). Morgan Stanley India Company Private Limited (MSICPL) may use AI tools in providing research services. All recommendations contained herein are made by the duly qualified research analysts.
For important disclosures, stock price charts and equity rating histories regarding companies that are the subject of this report, please see the Morgan Stanley Research Disclosure Website at www.morganstanley.com/eqr/disclosures/webapp/generalresearch, or contact your investment representative or Morgan Stanley Research at 1585 Broadway, (Attention: Research Management), New York, NY, 10036 USA.
For valuation methodology and risks associated with any recommendation, rating or price target referenced in this research report, please contact the Client Support Team as follows: US/Canada +1 800 303-2495; Hong Kong +852 2848-5999; Latin America +1 718 754-5444 (U.S.); London +44 (0)20-7425-8169; Singapore +65 6834-6860; Sydney +61 (0)2-9770-1505; Tokyo +81 (0)3-6836-9000. Alternatively you may contact your investment representative or Morgan Stanley Research at 1585 Broadway, (Attention: Research Management), New York, NY 10036 USA.