PDF 原檔:報告_GS_鴻海_20260706_original.pdf
圖片清單(已驗證 2026-07-07)
ingest 時建立的「眼見為憑」圖片索引,是 lib/ 嵌圖的唯一真相來源;嵌入時只從這裡挑分類為「真資料圖」的,不照 trimmed 引用順序猜。
| 檔名 | size | 分類 | 親眼所見內容 |
|---|---|---|---|
260706_gs_HH_001.png |
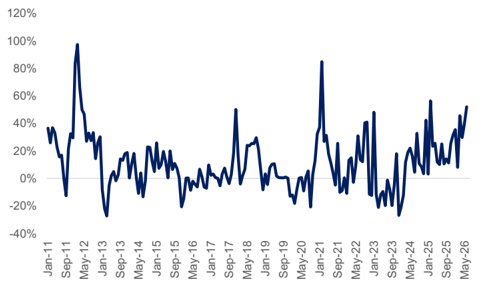
50KB | 真資料圖 | 鴻海月度 YoY% 成長走勢折線圖(Jan-11 to Jun-26),y 軸 -40% 至 +120%,可見 6 月 +52% YoY 峰值,顯示近期 YoY 成長加速 |
260706_gs_HH_002.png |
34KB | 裝飾·logo·banner | <40KB 未讀,略(預設 logo 或小圖) |
260706_gs_HH_003.png |
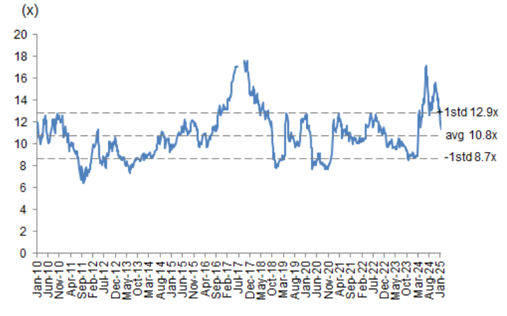
63KB | 真資料圖 | 鴻海 12M forward P/E 走勢圖(Jan-10 至 ~2025),均值 10.8x,+1std 12.9x,-1std 8.7x,含歷史 P/E 帶 |
260706_gs_HH_004.png |
76KB | 真資料圖 | GS 鴻海(2317.TW)評等與目標價歷史圖(2023-2026),標示歷次目標價(150→150→148→149→152→172→201→227→257→263→259→236→220→239→205→233→263→400)及 Buy 評等,右軸為台股加權指數走勢 |
原始內容
For the exclusive use of KEVINLU@LENOVO.COM
Hon Hai (2317.TW): Jun rev beat at +52% YoY; AI server racks to ramp up ahead; Buy (on CL)
Hon Hai's Jun revenues were +52% YoY / -4% MoM to NT$822bn, or 18% ahead of our previous estimates, leading 2Q26 revenues to be +40% YoY / +19% QoQ. From a MoM perspective, Consumer electronics and Cloud & Networking were fl attish MoM, management notes the pull-in momentum for AI products sustained, while being a ff ected by tight material supply. PC and Component & Others decreased MoM due to pull-in momentum. From a YoY perspective, PC, Component & Others, Cloud & Networking, and Consumer electronics segments all showed strong YoY growth, and management attributes it to strong pull-in momentum. Management guided 3Q to see both QoQ and YoY growth, given expectation for AI server racks to maintain growth, and Consumer electronics enters the peak season.
We expect continued growth of the AI server business with market share gain opportunities, along with the upcoming smartphone form factor changes in 2026E to drive Hon Hai's growth ahead. Maintain Buy (on CL).
Exhibit 1: Hon Hai's Jun revenues +52% YoY, or -4% MoM
Source: Company data
3-month revenues preview: We expect 3Q26E revenues to be +48% YoY / +22% QoQ to NT$3.1 trillion. June delivered strong YoY (+52% YoY), and we expect July revenues to remain strong at 51% YoY / 13% MoM to NT$929m, supported by AI rack server ramp up, and strong seasonality of consumer electronics business.
Goldman Sachs does and seeks to do business with companies covered in its research reports. As a result, investors should be aware that the fi rm may have a con fl ict of interest that could a ff ect the objectivity of this report. Investors should consider this report as only a single factor in making their investment decision. For Reg AC certi fi cation and other important disclosures, see the Disclosure Appendix, or go to www.gs.com/research/hedge.html. Analysts employed by non-US a ffi liates are not registered/quali fi ed as research
Allen Chang
+852-2978-2930 | allen.k.chang@gs.com Goldman Sachs (Asia) L.L.C.
Verena Jeng
+852-2978-1681 | verena.jeng@gs.com Goldman Sachs (Asia) L.L.C.
Ting Song +852-2978-6466 | ting.song@gs.com Goldman Sachs (Asia) L.L.C.
e92c7a75ab8b4efbba794e6b187208c8
For the exclusive use of KEVINLU@LENOVO.COM
Exhibit 2: We model Hon Hai's Jul 2026 revenue to be +51% YoY or +13% MoM Hon Hai's monthly/quarterly revenue
| Apr 2026 | May 2026 | June 2026 | July 2026E | Aug 2026E | Sep 2026E | 2Q26 | 3Q26E | |
|---|---|---|---|---|---|---|---|---|
| Revenues (NT$m) | 832,098 | 859,409 | 821,763 | 928,592 | 1,040,023 | 1,086,228 | 2,513,270 | 3,054,844 |
| YoY | 30% | 40% | 52% | 51% | 71% | 30% | 40% | 48% |
| MoM/QoQ | 4% | 3% | -4% | 13% | 12% | 4% | 19% | 22% |
| GS estimates (NT$m) | 819,812 | 815,456 | 695,162 | 2,386,670 | ||||
| Actual vs. GS | 1% | 5% | 18% | 5% |
Source: Company data, Goldman Sachs Global Investment Research
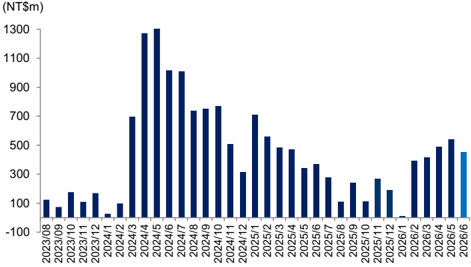
EV business in Jun 2026: Hon Hai's EV subsidiary Foxtron (2258.TW, Not Covered) reported Jun revenues of NT$455mn (vs. May-26 / Jun-25 revenues at NT$541mn / NT$371mn) . Post the announcement of its proposal to acquire Luxgen in December (report), Foxtron has announced its fi rst self-branded vehicle 'Foxtron Bria'. Also, the partnership with Mitsubishi Motors (7211.T, covered by Kota Yuzawa) on passenger cars (read more in our report) and zero emission buses (read more on the company's announcement) suggest incremental growth opportunities for Foxtron which could be positive for Hon Hai.
Exhibit 3: Foxtron's (Hon Hai's EV subsidiary) monthly revenues
Source: Company data
Earnings revision: We factor in Hon Hai's 2Q26 revenues and keep our 2026E-28E EPS estimates largely unchanged. We revise up revenues by 1%/ 16% in 2027/ 28E on higher revenues of AI rack server, while revise down GM due to product mix changes. Our positive outlook for Hon Hai is unchanged, driven by its rising AI cloud business and the upcoming form factor changes of smartphones.
Exhibit 4: Earnings revision
| NTDm | 2026E | 2026E | 2026E | 2027E | 2027E | 2027E | 2028E | 2028E | 2028E |
|---|---|---|---|---|---|---|---|---|---|
| Old | New | Chg | Old | New | Chg | Old | New | Chg | |
| Revenues | 11,057,373 | 11,099,298 | 0% | 13,795,323 | 14,000,932 | 1% | 15,585,758 | 18,055,832 | 16% |
| GP | 647,208 | 649,990 | 0% | 738,399 | 740,165 | 0% | 818,051 | 816,946 | 0% |
| OP | 364,002 | 365,019 | 0% | 415,584 | 414,056 | 0% | 466,437 | 465,760 | 0% |
| Net income | 269,742 | 270,555 | 0% | 317,625 | 316,262 | 0% | 357,316 | 356,326 | 0% |
| EPS (diluted, NT$) | 19.04 | 19.10 | 0% | 22.49 | 22.40 | 0% | 25.30 | 25.23 | 0% |
| Margins | |||||||||
| GM | 5.9% | 5.9% | 5.4% | 5.3% | 5.2% | 4.5% | |||
| OPM | 3.3% | 3.3% | 3.0% | 3.0% | 3.0% | 2.6% | |||
| NM | 2.4% | 2.4% | 2.3% | 2.3% | 2.3% | 2.0% |
Source: Company data, Goldman Sachs Global Investment Research
Valuation: Our 12m TP for Hon Hai is unchanged at NT$400 and remains based on a P/E (rolled fwd to 2027E from 2026E P/E, vs. previously implied 2027E P/E at 18x).
e92c7a75ab8b4efbba794e6b187208c8
Exmoll o. non nais 14m lorwara r/erato
(x)
20
18
6
2
For the exclusive use of KEVINLU@LENOVO.COM
Our target P/E multiple of 18.9x (vs. 21x 2026E P/E previously, or implied 2027E P/E at 18x) is derived from a peers' average ratio of trading P/E to forward year NI YoY growth and OPM (P/E divided by the sum of NI YoY and OPM). Our target P/E of 18.9x is the range of company's historical forward P/E since 2010, re fl ecting our positive view on Hon Hai's business expansion from the competitive consumer electronics market to AI servers and EVs outsourcing, which should drive pro fi t expansion with diversifying business opportunities for Hon Hai. Maintain Buy (on CL).
Exhibit 5: Hon Hai P&L Summary
| Hon Hai (2317.TW) | 2022 | 2023 | 2024 | 2025 | 2026E | 2027E | 2028E | 1Q25 | 2Q25 | 3Q25 | 4Q25 | 1Q26 | 2Q26E | 3Q26E | 4Q26E |
|---|---|---|---|---|---|---|---|---|---|---|---|---|---|---|---|
| NTD bn | |||||||||||||||
| P&L | |||||||||||||||
| Revenue | 6,627 | 6,162 | 6,860 | 8,103 | 11,099 | 14,001 | 18,056 | 1,644 | 1,793 | 2,059 | 2,606 | 2,120 | 2,513 | 3,055 | 3,412 |
| COGS | (6,227) | (5,774) | (6,431) | (7,605) | (10,449) | (13,261) | (17,239) | (1,544) | (1,680) | (1,928) | (2,453) | (1,989) | (2,371) | (2,872) | (3,218) |
| Gross profit | 400 | 388 | 429 | 498 | 650 | 740 | 817 | 101 | 114 | 131 | 153 | 131 | 142 | 183 | 194 |
| Operating expense | (226) | (221) | (228) | (239) | (285) | (326) | (351) | (54) | (57) | (60) | (68) | (55) | (73) | (74) | (83) |
| EBITDA | 250 | 251 | 288 | 347 | 466 | 536 | 589 | 70 | 80 | 95 | 102 | 101 | 95 | 134 | 136 |
| D&A | (76) | (84) | (88) | (88) | (101) | (121) | (124) | (24) | (23) | (25) | (16) | (25) | (25) | (25) | (25) |
| EBIT | 174 | 167 | 201 | 259 | 365 | 414 | 466 | 46 | 57 | 71 | 86 | 76 | 70 | 109 | 111 |
| Net interest income/(expense) | 9 | 16 | 9 | 4 | 3 | 17 | 16 | 1 | (1) | (3) | 7 | 1 | 1 | 1 | 1 |
| Disposal of assets (pre-tax) | 4 | 15 | 2 | 7 | 0 | 0 | 0 | 0 | 1 | 6 | 0 | 0 | 0 | 0 | 0 |
| Others | 1 | (5) | 1 | 23 | 13 | 12 | 12 | 12 | 9 | 13 | (10) | (2) | 5 | 5 | 5 |
| Pretax profit | 188 | 192 | 212 | 293 | 380 | 443 | 494 | 59 | 65 | 87 | 82 | 74 | 75 | 114 | 117 |
| Income tax | (36) | (37) | (40) | (78) | (76) | (93) | (104) | (13) | (16) | (21) | (29) | (15) | (15) | (23) | (23) |
| Minorities | (10) | (13) | (19) | (26) | (34) | (34) | (34) | (4) | (5) | (8) | (8) | (8) | (8) | (8) | (8) |
| Net income | 141 | 142 | 153 | 189 | 271 | 316 | 356 | 42 | 44 | 58 | 45 | 50 | 52 | 83 | 85 |
| EPS (NTD) | 10.04 | 10.07 | 10.79 | 13.43 | 19.10 | 22.40 | 25.23 | 2.98 | 3.16 | 4.08 | 3.20 | 3.54 | 3.68 | 5.88 | 6.01 |
| DPS (NTD) | 5.22 | 5.31 | 5.70 | 7.15 | 10.16 | 11.92 | 13.43 | ||||||||
| Dividend payout ratio | 52% | 53% | 53% | 53% | 53% | 53% | 53% | ||||||||
| YoY% growth & margins | |||||||||||||||
| Revenue growth | 11% | -7% | 11% | 18% | 37% | 26% | 29% | 24% | 16% | 11% | 22% | 29% | 40% | 48% | 31% |
| EBITDA growth | 11% | 0% | 15% | 20% | 34% | 15% | 10% | 23% | 25% | 25% | 12% | 44% | 19% | 40% | 34% |
| EBIT growth | 17% | -4% | 20% | 29% | 41% | 13% | 12% | 27% | 27% | 29% | 33% | 63% | 23% | 54% | 30% |
| Net income growth | 2% | 0% | 7% | 24% | 43% | 17% | 13% | 91% | 27% | 17% | -2% | 19% | 17% | 44% | 88% |
| EPS growth | 1% | 0% | 7% | 24% | 42% | 17% | 13% | 90% | 26% | 16% | 0% | 19% | 16% | 44% | 88% |
| Gross margin | 6.0% | 6.3% | 6.3% | 6.1% | 5.9% | 5.3% | 4.5% | 6.1% | 6.3% | 6.4% | 5.9% | 6.2% | 5.7% | 6.0% | 5.7% |
| EBITDA margin | 3.8% | 4.1% | 4.2% | 4.3% | 4.2% | 3.8% | 3.3% | 4.3% | 4.5% | 4.6% | 3.9% | 4.8% | 3.8% | 4.4% | 4.0% |
| EBIT margin | 2.6% | 2.7% | 2.9% | 3.2% | 3.3% | 3.0% | 2.6% | 2.8% | 3.2% | 3.4% | 3.3% | 3.6% | 2.8% | 3.6% | 3.3% |
Source: Company data, Goldman Sachs Global Investment Research
Exhibit 6: Hon Hai's 12M forward P/E ratio
Source: Eikon Datastream
Price Target Risks and Methodology - Hon Hai
Valuation methodology: We are Buy rated on Hon Hai. Our 12-month target price of NT$400 is based on a 18.9x 2027E P/E multiple, which is set in line with peers' PEG&M ratio (i.e., P/E vs. forward-year earnings growth and OPM).
Key downside risks: (1) slower-than-expected ramp-up of the AI server business; (2) weaker-than-expected EV total solution performance across EV assembly, design, software, and semis; (3) slower-than-expected ramp-up of capacity globally; and (4) fi ercer-than-expected competition in the consumer electronics EMS business.
e92c7a75ab8b4efbba794e6b187208c8
For the exclusive use of KEVINLU@LENOVO.COM
2317.TW
12m Price Target:
NT$400.00
Price:
NT$240.50
Upside: 66.3%
| Buy CL | GS Forecast | ||||
|---|---|---|---|---|---|
| Market c ap: NT$3.4tr / $1 06 . 7bn En terpr is e v a lu e: NT$3. 2 tr / $1 0 1.1 bn 3 m AD T V : NT$ 2 1.4 bn / $ 677 . 7mn Ta iw a n G reater Chin a Te chnology M &A R a n k: 3 L ea s e s incl . in n et d e b t & EV? : N o | Revenue (NT$m n ) N e w Revenue (NT$ mn) Old EBITD A (NT$ mn) E PS(NT$) N e w EPS (NT$) Old P/E (X) P/B (X) Dividend yield (%) CROCI (%) | 12/25 8 , 1 03, 1 04. 8 8,1 0 3,1 0 4.8 347,22 0 .9 1 3.4 1 13.41 13.9 1.5 3.8 14. 0 | 12/26E 11 ,099, 2 9 8 . 1 11, 0 57,372.6 466,479.3 1 9. 1 0 19. 0 4 12.6 1.8 4.2 16.4 | 12/27E 1 4,000,93 1 .9 13,795,323.3 535,51 0 .5 22 .40 22.49 1 0 .7 1.7 5. 0 17.8 | 12/28E 18 ,0 55 , 8 3 2 . 2 15,585,757.7 589,495.9 25 . 2 3 25.3 0 9.5 1.6 5.6 16.6 |
Source: Company data, Goldman Sachs Research estimates, FactSet. Price as of 3 Jul 2026 close.
e92c7a75ab8b4efbba794e6b187208c8
For the exclusive use of KEVINLU@LENOVO.COM