PDF 原檔:報告_GS_鴻海2317_20260813_original.pdf
圖片清單(已驗證 2026-08-14)
| 檔名 | size | 分類 | 親眼所見內容 |
|---|---|---|---|
報告_GS_鴻海2317_20260813_001.png |
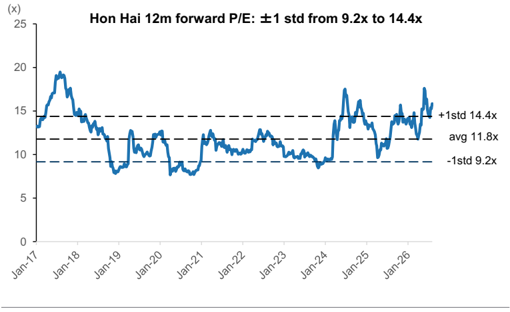
42KB | 真資料圖 | 「Hon Hai 12m forward P/E: ±1 std from 9.2x to 14.4x」走勢圖(2017/01–2026),標示 +1std 14.4x、avg 11.8x、-1std 9.2x 三條水平線 |
報告_GS_鴻海2317_20260813_002.png |
78KB | 真資料圖 | 「Hon Hai (2317.TW) Goldman Sachs rating and stock price target history」圖(2023-2026),藍點+數字為歷次目標價(可見 148、151、147、127、150、152、201、227、257、259、283、236、205、220、233、242、263、283、400),淺藍線為股價、灰線為 Taiwan SE Weighted Index;下方標示評等區間 B(Buy);來源標註 FactSet closing prices as of 6/30/2026、Covered by Allen Chang |
原始內容
For the exclusive use of KEVINLU@LENOVO.COM
Hon Hai (2317.TW): AI server continuous ramp-up ahead across GPU/
ASIC; 2Q26 OP beat; Buy (on CL)
3Q26 revenues outlook: The company expects (1) YoY growth in Cloud and Networking revenues, driven by strong GPU/ ASIC AI servers and AI switch; ( 2) YoY increase in Consumer electronics , riding on the speci fi cation upgrade of new products; (3) YoY increase in PCs on AI products upgrade; and (4) YoY increase in Components and others. Management maintain 3Q guidance and expect to see both QoQ and YoY revenues growth in 3Q26. We maintain our positive view on Hon Hai, driven by AI servers, foldable phones, and EV outsourcing. With vertical integration of systems and components, coupled with global production capabilities, we expect Hon Hai to leverage its scale advantages into long-term order and market share sustainability. Maintain Buy (on CL). Read more: FII 2Q result.
2Q26 beat: GM remained at 6.1% in 2Q26 (vs. 6.3%/ 6.2% in 2Q25/ 1Q26), higher than our and Bloomberg consensus estimates at 5.7%/ 6.0%, re fl ecting mix upgrade and cost management. Opex ratio was down to 2.4% in 2Q26 (vs. 3.2%/ 2.6% in 2Q25/ 1Q26), resulting in OP beating our and Bloomberg estimates by 36%/ 18%, driven by the company's improving operational e ffi ciency. 2Q26 NI was up 35% YoY to NT$60bn, or 15%/ 8% higher than our estimates and consensus.
Exhibit 1: Hon Hai 2Q26 result snapshot
| NTm | 2Q25 | 1Q26 | 2Q26 | QoQ | YoY | GS | Act/GS | Cons. | Act/Cons. |
|---|---|---|---|---|---|---|---|---|---|
| Revenues | 1,793,468 | 2,119,533 | 2,525,894 | 19% | 41% | 2,513,270 | 1% | 2,470,000 | 2% |
| GP | 113,529 | 130,981 | 154,533 | 18% | 36% | 142,479 | 8% | 148,200 | 4% |
| OP | 56,596 | 75,649 | 94,803 | 25% | 68% | 69,845 | 36% | 80,534 | 18% |
| Net income | 44,361 | 49,919 | 59,974 | 20% | 35% | 51,961 | 15% | 55,439 | 8% |
| Margins | |||||||||
| GM | 6.3% | 6.2% | 6.1% | -0.1ppt | -0.2ppt | 5.7% | 0.4ppt | 6.0% | 0.1ppt |
| OPM | 3.2% | 3.6% | 3.8% | 0.2ppt | 0.6ppt | 2.8% | 1ppt | 3.3% | 0.5ppt |
| NM | 2.5% | 2.4% | 2.4% | 0ppt | -0.1ppt | 2.1% | 0.3ppt | 2.2% | 0.1ppt |
Source: Company data, Goldman Sachs Global Investment Research, Bloomberg
Key takeaways from earnings call
- 2026E outlook: Hon Hai expects YoY revenue growth in 2026, and management n highlighted the improving visibility, supported by YoY growth in Cloud & Networking as well as Consumer electronics. PC will see YoY decline, per management, and Components & Others will be fl at YoY.
- AI servers ramp-up: Management expects AI server rack shipment to grow high n double-digit QoQ in 3Q26, and strong shipment growth of AI server rack in 2026, supported by strong demand and market share gain.
- EV business progress: The company expects the delivery of the Model B in AUS n and NZ by end of 2026, and the delivery of CAVIRA in Taiwan has begun from
Goldman Sachs does and seeks to do business with companies covered in its research reports. As a result, investors should be aware that the fi rm may have a con fl ict of interest that could a ff ect the objectivity of this report. Investors should consider this report as only a single factor in making their investment decision. For Reg AC certi fi cation and other important disclosures, see the Disclosure Appendix, or go to www.gs.com/research/hedge.html. Analysts employed by non-US a ffi liates are not registered/quali fi ed as research analysts with FINRA in the U.S.
Allen Chang
+852-2978-2930 | allen.k.chang@gs.com Goldman Sachs (Asia) L.L.C.
Verena Jeng
+852-2978-1681 | verena.jeng@gs.com Goldman Sachs (Asia) L.L.C.
Ting Song +852-2978-6466 | ting.song@gs.com Goldman Sachs (Asia) L.L.C.
e92c7a75ab8b4efbba794e6b187208c8
For the exclusive use of KEVINLU@LENOVO.COM
July 2026.
Exhibit 2: Hon Hai monthly/ quarterly revenues
| May 2026 | June 2026 | July 2026 | Aug 2026E | Sep 2026E | Oct 2026E | 2Q26 | 3Q26E | |
|---|---|---|---|---|---|---|---|---|
| Revenues (NT$m) | 859,409 | 821,763 | 946,513 | 1,031,699 | 1,059,769 | 1,112,757 | 2,525,894 | 3,037,980 |
| YoY | 40% | 52% | 54% | 70% | 27% | 24% | 41% | 48% |
| MoM/QoQ | 3% | -4% | 15% | 9% | 3% | 5% | 19% | 20% |
| GS estimates (NT$m) | 815,456 | 695,162 | 928,592 | 2,386,670 | ||||
| Actual vs. GS | 5% | 18% | 2% | 6% |
Source: Company data, Goldman Sachs Global Investment Research
Earnings revision: We factor in the 2Q26 earnings and revise up 2026E earnings by 1% on higher-than-expected GM and lower-than-expected Opex ratio, while non-OP is lower than expected. We keep 2027/ 28E earnings largely unchanged.
Exhibit 3: Earnings revision
| NTDm | 2026E | 2026E | 2026E | 2027E | 2027E | 2027E | 2028E | 2028E | 2028E |
|---|---|---|---|---|---|---|---|---|---|
| Old | New | Chg | Old | New | Chg | Old | New | Chg | |
| Revenues | 11,099,298 | 11,068,297 | 0% | 14,000,932 | 14,028,433 | 0% | 18,055,832 | 18,122,500 | 0% |
| GP | 649,990 | 658,118 | 1% | 740,165 | 740,692 | 0% | 816,946 | 820,946 | 0% |
| OP | 365,019 | 381,329 | 4% | 414,056 | 413,913 | 0% | 465,760 | 468,463 | 1% |
| Net income | 270,555 | 273,483 | 1% | 316,262 | 317,239 | 0% | 356,326 | 356,795 | 0% |
| EPS (diluted, NT$) | 19.10 | 19.26 | 1% | 22.40 | 22.35 | 0% | 25.23 | 25.13 | 0% |
| Margins | |||||||||
| GM | 5.9% | 5.9% | 5.3% | 5.3% | 4.5% | 4.5% | |||
| OPM | 3.3% | 3.4% | 3.0% | 3.0% | 2.6% | 2.6% | |||
| NM | 2.4% | 2.5% | 2.3% | 2.3% | 2.0% | 2.0% |
Source: Company data, Goldman Sachs Global Investment Research
Valuation: Our 12m TP for Hon Hai is unchanged at NT$400 and remains based on a P/E. Our target 2027E P/E multiple of 18.9x is derived from a peers' average ratio of trading P/E to forward year NI YoY growth and OPM (P/E divided by the sum of NI YoY and OPM). Our target P/E of 18.9x is in the range of company's historical forward P/E since 2010, re fl ecting our positive view on Hon Hai's business expansion from the competitive consumer electronics market to AI servers and EVs outsourcing, which should drive pro fi t expansion with diversifying business opportunities for Hon Hai. Maintain Buy (on CL).
Exhibit 4: Hon Hai P&L summary
| Hon Hai (2317.TW) | 2022 | 2023 | 2024 | 2025 | 2026E | 2027E | 2028E | 1Q25 | 2Q25 | 3Q25 | 4Q25 | 1Q26 | 2Q26 | 3Q26E | 4Q26E |
|---|---|---|---|---|---|---|---|---|---|---|---|---|---|---|---|
| NTD bn | |||||||||||||||
| P&L | |||||||||||||||
| Revenue | 6,627 | 6,162 | 6,860 | 8,103 | 11,068 | 14,028 | 18,122 | 1,644 | 1,793 | 2,059 | 2,606 | 2,120 | 2,526 | 3,038 | 3,385 |
| COGS | (6,227) | (5,774) | (6,431) | (7,605) | (10,410) | (13,288) | (17,302) | (1,544) | (1,680) | (1,928) | (2,453) | (1,989) | (2,371) | (2,857) | (3,194) |
| Gross profit | 400 | 388 | 429 | 498 | 658 | 741 | 821 | 101 | 114 | 131 | 153 | 131 | 155 | 181 | 191 |
| Operating expense | (226) | (221) | (228) | (239) | (277) | (327) | (352) | (54) | (57) | (60) | (68) | (55) | (60) | (76) | (85) |
| EBITDA | 250 | 251 | 288 | 347 | 483 | 536 | 592 | 70 | 80 | 95 | 111 | 102 | 122 | 132 | 127 |
| D&A | (76) | (84) | (88) | (88) | (102) | (122) | (124) | (24) | (23) | (25) | (26) | (27) | (27) | (27) | (21) |
| EBIT | 174 | 167 | 201 | 259 | 381 | 414 | 468 | 46 | 57 | 71 | 86 | 76 | 95 | 105 | 106 |
| Net interest income/(expense) | 9 | 16 | 9 | (7) | (4) | 11 | 11 | 1 | (1) | (3) | (4) | (3) | (3) | (3) | 6 |
| Disposal of assets (pre-tax) | 4 | 15 | 2 | 7 | 1 | 0 | 0 | 0 | 1 | 6 | 0 | 1 | 0 | 0 | 0 |
| Others | 1 | (5) | 1 | 34 | 14 | 17 | 13 | 12 | 9 | 13 | 0 | 0 | 3 | 6 | 6 |
| Pretax profit | 188 | 192 | 212 | 293 | 393 | 442 | 492 | 59 | 65 | 87 | 82 | 74 | 95 | 107 | 117 |
| Income tax | (36) | (37) | (40) | (78) | (84) | (93) | (103) | (13) | (16) | (21) | (29) | (17) | (22) | (21) | (23) |
| Minorities | (10) | (13) | (19) | (26) | (36) | (32) | (32) | (4) | (5) | (8) | (8) | (7) | (13) | (8) | (8) |
| Net income | 141 | 142 | 153 | 189 | 273 | 317 | 357 | 42 | 44 | 58 | 45 | 50 | 60 | 78 | 86 |
| EPS (NTD) | 10.04 | 10.07 | 10.79 | 13.43 | 19.26 | 22.35 | 25.13 | 2.98 | 3.16 | 4.08 | 3.20 | 3.52 | 4.22 | 5.47 | 6.05 |
| DPS (NTD) | 5.22 | 5.31 | 5.70 | 7.15 | 10.25 | 11.89 | 13.38 | ||||||||
| Dividend payout ratio | 52% | 53% | 53% | 53% | 53% | 53% | 53% | ||||||||
| YoY% growth & margins | |||||||||||||||
| Revenue growth | 11% | -7% | 11% | 18% | 37% | 27% | 29% | 24% | 16% | 11% | 22% | 29% | 41% | 48% | 30% |
| EBITDA growth | 11% | 0% | 15% | 20% | 39% | 11% | 11% | 23% | 25% | 25% | 22% | 46% | 52% | 38% | 14% |
| EBIT growth | 17% | -4% | 20% | 29% | 47% | 9% | 13% | 27% | 27% | 29% | 33% | 63% | 68% | 49% | 24% |
| Net income growth | 2% | 0% | 7% | 24% | 44% | 16% | 12% | 91% | 27% | 17% | -2% | 19% | 35% | 35% | 90% |
| EPS growth | 1% | 0% | 7% | 24% | 43% | 16% | 12% | 90% | 26% | 16% | 0% | 18% | 34% | 34% | 89% |
| Gross margin | 6.0% | 6.3% | 6.3% | 6.1% | 5.9% | 5.3% | 4.5% | 6.1% | 6.3% | 6.4% | 5.9% | 6.2% | 6.1% | 6.0% | 5.7% |
| EBITDA margin | 3.8% | 4.1% | 4.2% | 4.3% | 4.4% | 3.8% | 3.3% | 4.3% | 4.5% | 4.6% | 4.3% | 4.8% | 4.8% | 4.3% | 3.8% |
| EBIT margin | 2.6% | 2.7% | 2.9% | 3.2% | 3.4% | 3.0% | 2.6% | 2.8% | 3.2% | 3.4% | 3.3% | 3.6% | 3.8% | 3.4% | 3.1% |
Source: Company data, Goldman Sachs Global Investment Research
e92c7a75ab8b4efbba794e6b187208c8
For the exclusive use of KEVINLU@LENOVO.COM
Exhibit 5: Hon Hai 12M forward P/E
Source: Company data, Goldman Sachs Global Investment Research
Price Target Risks and Methodology - Hon Hai
Valuation methodology: We are Buy rated on Hon Hai. Our 12-month target price of NT$400 is based on a 18.9x 2027E P/E multiple, which is set in line with peers' PEG&M ratio (i.e., P/E vs. forward-year earnings growth and OPM).
Key downside risks: (1) slower-than-expected ramp-up of the AI server business; (2) weaker-than-expected EV total solution performance across EV assembly, design, software, and semis; (3) slower-than-expected ramp-up of capacity globally; and (4) fi ercer-than-expected competition in the consumer electronics EMS business.
2317.TW
12m Price Target:
NT$400.00
Price:
NT$270.00
Upside:
48.1%
| Buy CL | GS Forecast | ||||
|---|---|---|---|---|---|
| Market c ap: NT$3.8tr / $118. 7bn En terpr is e v a lu e: NT$3.8tr / $11 7 . 9bn 3 m AD T V : NT$18. 7bn / $ 5 88. 0mn Ta iw a n G reater Chin a Te chnology M &A R a n k: 3 L ea s e s incl . in n et d e b t & EV? : N o | Revenue (NT$m n ) N e w Revenue (NT$ mn) Old EBITD A (NT$ mn) E PS(NT$) N e w EPS (NT$) Old P/E (X) P/B (X) Dividend yield (%) CROCI (%) | 12/25 8 , 1 03, 1 04. 8 8,103,104.8 347,220.9 1 3.4 1 13.41 13.9 1.5 3.8 14.3 | 12/26E 11 ,0 68 , 2 9 7 .0 11,099,298.1 482,870.9 1 9. 26 19.10 14.0 2.0 3.8 16.7 | 12/27E 1 4,0 28 ,43 2 . 8 14,000,931.9 535,577.1 22 .3 5 22.40 12.1 1.9 4.4 17.8 | 12/28E 18 , 122 ,499. 6 18,055,832.2 592,423.6 25 . 1 3 25.23 10.7 1.7 5.0 16.6 |
| 6/26 | 9 /26E | 12/26E | 3 /27E |
Source: Company data, Goldman Sachs Research estimates, FactSet. Price as of 12 Aug 2026 close.
e92c7a75ab8b4efbba794e6b187208c8
For the exclusive use of KEVINLU@LENOVO.COM