PDF 原檔:報告_Daiwa_儒鴻1476_20260818_original.pdf
圖片清單(已驗證 2026-08-19)
分類為「真資料圖」者才可嵌入 lib/ 頁,圖說須照抄下表「親眼所見內容」。標「未驗證」者一律不得嵌入;若日後需要,須先逐張 Read 現場補驗。
| 檔名 | size | 分類 | 親眼所見內容 |
|---|---|---|---|
報告_Daiwa_儒鴻1476_20260818_001–_003 |
27–45KB | 未驗證 | 未逐張 Read(圖說標示為 Share price performance、margin trend、1-year forward PER),不得嵌入 lib |
原始內容
Taiwan
Eclat Textile (1476 TT)
Target price:
TWD460.00 (from TWD560.00)
Share price (18 Aug): TWD310.50 | Up/downside: +48.1%
2Q26 results review: held up well despite inflation
- 2026: gross margin guidance unchanged at 28-32%
- New products revenue account for 15% of 1H26 revenue
- Reaffirming our Buy (1) rating; lowering 12-month TP to TWD460
What's new: Eclat held an investor conference on 18 August to discuss its 2Q26 results (see our memo , 6 August) and its outlook for 2H26. We reaffirm our Buy (1) rating, as we expect its gross margin to improve in 2H26, as the acquisition of new clients and product development underpin its profit growth momentum. Eclat is in a relatively solid position to gain market share with functionality upgrades designed to navigate macroeconomic uncertainties, such as US inflation and oil price hikes.
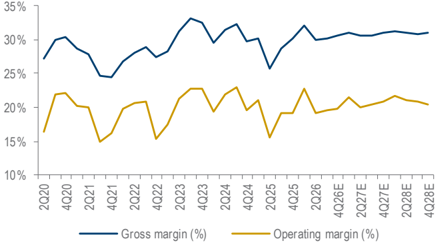
What's the impact: Key highlights of 2Q26 results (details in p2): results missed market expectations. Its 2Q26 gross margin came in at 30.0% (vs. 32.2% in 1Q26 and 25.7% in 2Q25), in line with our estimate (30.0%) but missing consensus (31.1%). Management attributed the decline to a less favourable product mix and the negative impact from increased raw material costs. However, with higher-than-expected personnel expenses from rising labour headcount and salaries, its operating margin of 19.2% (vs. 22.8% in 1Q26 and 15.4% in 2Q25) missed our estimate (20.2%) and the Bloomberg consensus (21.2%).
Unchanged 2026 order outlook and gross margin guidance. Its order visibility remains at 6 months, and the company aims to deliver monthly revenue of TWD3bn+ (vs. its July revenue of TWD3.7bn) for the remaining months of 2026. Despite the inflationary environment in the US, the company believes order placement momentum and new product development remain intact. Management maintains its gross margin guidance for 2026 at 28-32% as the positive impact from new products' contribution is offset by carryover products, and will review it again by end2026. However, we expect its gross margin in 2H26 to likely improve from 30% in 2Q26 on a better raw materials environment and revenue contributions from new products and clients. We trim our 2026-28E EPS by 1%, mainly on our more conservative operating margin assumptions.
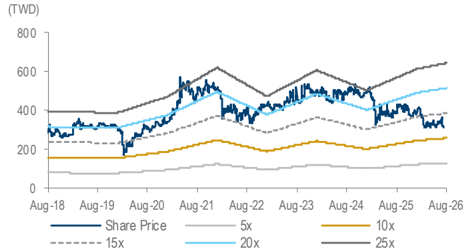
What we recommend: We reaffirm our Buy (1) rating but lower our 12month TP to TWD460 (from TWD560), now based on a target PER of 18x (from 22x, close to the midpoint of its past-5-year range of 12-27x [average PER of 20x]) due to decelerating earnings CAGR of 8.9% over 2026-28E from 15.0% over 2025-27E, and on 1-year forward EPS. Key downside risks: slower-than-expected gross margin expansion; lower-than-expected demand; and uncertainty over high inflation and tariffs.
How we differ: Our 2026-28E EPS are 2-5% below Bloomberg consensus, likely as we are slightly conservative on Eclat's revenue and operating margins assumptions.
18 August 2026
Daiwa
5
3
→
2
1
Buy
Helen Chien
Helen Chien
(886) 2 8758 6254
helen.chien@daiwacm-cathay.com.tw
Neil Teng, CFA (886) 2 8758 6256 neil.teng@daiwacm-cathay.com.tw
Forecast revisions (%)
| Year to 31 Dec | 26E | 27E | 28E |
|---|---|---|---|
| Revenue change | - | (0.5) | (1.0) |
| Net profit change | (1.2) | (1.4) | (1.4) |
| Core EPS (FD) change | (1.1) | (1.3) | (1.3) |
Source: Daiwa forecasts
Share price performance
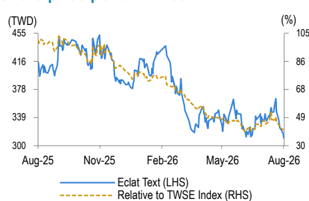
| 12-month range | 310.50-452.00 |
|---|---|
| Market cap (USDbn) | 2.68 |
| 3m avg daily turnover (USDm) | 19.33 |
| Shares outstanding (m) | 274 |
| Major shareholder | Zhen-Hai Hong (Chairman) (3.3%) |
Financial summary (TWD)
| Year to 31 Dec | 26E | 27E | 28E |
|---|---|---|---|
| Revenue (m) | 40,570 | 43,675 | 47,077 |
| Operating profit (m) | 8,215 | 9,041 | 9,886 |
| Net profit (m) | 6,712 | 7,293 | 7,962 |
| Core EPS (fully-diluted) | 24.454 | 26.567 | 29.006 |
| EPS change (%) | 21.7 | 8.6 | 9.2 |
| Daiwa vs Cons. EPS (%) | (2.1) | (2.1) | (4.6) |
| PER (x) | 12.7 | 11.7 | 10.7 |
| Dividend yield (%) | 5.9 | 6.4 | 7.0 |
| DPS | 18.3 | 19.9 | 21.8 |
| PBR (x) | 2.6 | 2.5 | 2.3 |
| EV/EBITDA (x) | 9.1 | 8.2 | 7.4 |
| ROE (%) | 21.7 | 21.9 | 22.3 |
Source: FactSet, Daiwa forecasts
Eclat: revenue and earnings forecasts revisions
| 2026E | 2026E | 2026E | 2027E | 2027E | 2027E | 2028E | 2028E | 2028E | |
|---|---|---|---|---|---|---|---|---|---|
| (TWDm) | New | Previous | Change | New | Previous | Change | New | Previous | Change |
| Fabric revenue | 12,765 | 13,286 | -3.9% | 13,020 | 13,823 | -5.8% | 13,281 | 14,381 | -7.7% |
| Garment revenue | 27,805 | 27,275 | 1.9% | 30,655 | 30,071 | 1.9% | 33,797 | 33,153 | 1.9% |
| Sales | 40,570 | 40,561 | 0.0% | 43,675 | 43,894 | -0.5% | 47,077 | 47,534 | -1.0% |
| Gross profit | 12,475 | 12,371 | 0.8% | 13,452 | 13,475 | -0.2% | 14,594 | 14,641 | -0.3% |
| Gross profit margin | 30.8% | 30.5% | 0.3pp | 30.8% | 30.7% | 0.1pp | 31.0% | 30.8% | 0.2pp |
| Operating profit | 8,215 | 8,396 | -2.2% | 9,041 | 9,218 | -1.9% | 9,886 | 10,077 | -1.9% |
| Operating profit margin | 20.3% | 20.7% | -0.4pp | 20.7% | 21.0% | -0.3pp | 21.0% | 21.2% | -0.2pp |
| Net profit | 6,712 | 6,797 | -1.2% | 7,293 | 7,396 | -1.4% | 7,962 | 8,077 | -1.4% |
| Net profit margin | 16.5% | 16.8% | -0.2pp | 16.7% | 16.9% | -0.2pp | 16.9% | 17.0% | -0.1pp |
| EPS (TWD) | 24.45 | 24.73 | -1.1% | 26.57 | 26.91 | -1.3% | 29.01 | 29.38 | -1.3% |
Source: Daiwa forecasts
Eclat: 2Q26 results vs. Daiwa and Bloomberg forecasts
| (TWDm) | Eclat's 2Q26 results | Daiwa's previous forecast | Difference | Bloomberg consensus | Difference |
|---|---|---|---|---|---|
| Revenue | 10,086 | 10,264 | -1.7% | 10,206 | -1.2% |
| Gross profit | 3,027 | 3,079 | -1.7% | 3,176 | -4.7% |
| Operating profit | 1,935 | 2,069 | -6.5% | 2,167 | -10.7% |
| Profit before tax | 2,009 | 2,100 | -4.4% | 2,198 | -8.6% |
| Net profit | 1,553 | 1,522 | 2.0% | 1,688 | -8.0% |
| Basic EPS (TWD) | 5.66 | 5.55 | 2.1% | 6.13 | -7.6% |
| Margin | |||||
| Gross margin | 30.0% | 30.0% | 0pp | 31.1% | -1.1pp |
| Operating margin | 19.2% | 20.2% | -1pp | 21.2% | -2.1pp |
| Pre-tax margin | 19.9% | 20.5% | -0.5pp | 21.5% | -1.6pp |
| Net margin | 15.4% | 14.8% | 0.6pp | 16.5% | -1.1pp |
Source: Company, Bloomberg, Daiwa forecasts
Eclat: quarterly P&L
| 2026E | 2026E | 2026E | 2026E | 2027E | 2026E | 2027E | 2028E | ||||
|---|---|---|---|---|---|---|---|---|---|---|---|
| (TWDm) | 1Q26 | 2Q26E | 3Q26E | 4Q26E | 1Q27E | 2Q27E | 3Q27E | 4Q27E | |||
| Revenue | 9,621 | 10,086 | 10,352 | 10,510 | 10,300 | 10,900 | 11,100 | 11,375 | 40,570 | 43,675 | 47,077 |
| Gross profit | 3,095 | 3,027 | 3,126 | 3,227 | 3,193 | 3,325 | 3,408 | 3,527 | 12,475 | 13,452 | 14,594 |
| Operating profit | 2,195 | 1,935 | 2,016 | 2,069 | 2,223 | 2,190 | 2,268 | 2,361 | 8,215 | 9,041 | 9,886 |
| Pre-tax profit | 2,291 | 2,009 | 2,063 | 2,116 | 2,266 | 2,232 | 2,310 | 2,403 | 8,478 | 9,211 | 10,057 |
| Net profit | 1,835 | 1,553 | 1,632 | 1,693 | 1,814 | 1,726 | 1,828 | 1,925 | 6,712 | 7,293 | 7,962 |
| Basic EPS (TWD) | 6.69 | 5.66 | 5.95 | 6.17 | 6.61 | 6.29 | 6.66 | 7.02 | 24.46 | 26.58 | 29.02 |
| Margin | |||||||||||
| Gross margin | 32.2% | 30.0% | 30.2% | 30.7% | 31.0% | 30.5% | 30.7% | 31.0% | 30.8% | 30.8% | 31.0% |
| Operating margin | 22.8% | 19.2% | 19.5% | 19.7% | 21.6% | 20.1% | 20.4% | 20.8% | 20.3% | 20.7% | 21.0% |
| Pre-tax margin | 23.8% | 19.9% | 19.9% | 20.1% | 22.0% | 20.5% | 20.8% | 21.1% | 20.9% | 21.1% | 21.4% |
| Net margin | 19.1% | 15.4% | 15.8% | 16.1% | 17.6% | 15.8% | 16.5% | 16.9% | 16.5% | 16.7% | 16.9% |
| YoY | |||||||||||
| Revenue | 2.6% | 3.8% | 7.5% | 13.5% | 7.1% | 8.1% | 7.2% | 8.2% | 6.8% | 7.7% | 7.8% |
| Gross profit | 9.3% | 21.4% | 13.2% | 15.4% | 3.2% | 9.8% | 9.0% | 9.3% | 14.6% | 7.8% | 8.5% |
| Operating profit | 11.1% | 28.9% | 9.6% | 16.6% | 1.3% | 13.2% | 12.5% | 14.1% | 15.8% | 10.0% | 9.4% |
| Pre-tax profit | 9.8% | 142.2% | -1.2% | 7.9% | -1.1% | 11.1% | 12.0% | 13.6% | 21.7% | 8.6% | 9.2% |
| Net profit | 9.2% | 158.3% | -1.2% | 7.0% | -1.1% | 11.1% | 12.0% | 13.7% | 21.7% | 8.6% | 9.2% |
| QoQ | |||||||||||
| Revenue | 3.9% | 4.8% | 2.6% | 1.5% | -2.0% | 5.8% | 1.8% | 2.5% | |||
| Gross profit | 10.7% | -2.2% | 3.3% | 3.2% | -1.1% | 4.1% | 2.5% | 3.5% | |||
| Operating profit | 23.6% | -11.8% | 4.2% | 2.6% | 7.4% | -1.5% | 3.6% | 4.1% | |||
| Pre-tax profit | 16.9% | -12.3% | 2.7% | 2.6% | 7.1% | -1.5% | 3.5% | 4.0% | |||
| Net profit | 16.0% | -15.4% | 5.1% | 3.7% | 7.2% | -4.9% | 5.9% | 5.3% |
Source: Company, Daiwa forecasts
Eclat: margin trend
Source: Company, Daiwa forecasts
Eclat Textile (1476 TT): 18 August 2026
Eclat: 1-year forward PER
Source: Bloomberg, Daiwa forecasts
Daiwa
Financial summary
Key assumptions
| Year to 31 Dec | 2021 | 2022 | 2023 | 2024 | 2025 | 2026E | 2027E | 2028E |
|---|---|---|---|---|---|---|---|---|
| Garment revenue growth (YoY %) | 16.9 | 5.2 | (22.6) | 23.9 | 6.2 | 10.3 | 10.3 | 10.3 |
| Fabric revenue growth (YoY %) | 52.9 | 21.8 | (22.4) | 12.5 | (2.3) | (0.0) | 2 | 2 |
| Gross margin (%) | 26.4 | 27.8 | 31.4 | 30.9 | 28.6 | 30.8 | 30.8 | 31 |
Profit and loss (TWDm)
| Year to 31 Dec | 2021 | 2022 | 2023 | 2024 | 2025 | 2026E | 2027E | 2028E |
|---|---|---|---|---|---|---|---|---|
| Garment revenue | 23,552 | 24,774 | 19,174 | 23,755 | 25,220 | 27,805 | 30,655 | 33,797 |
| Fabric revenue | 12,284 | 14,962 | 11,617 | 13,073 | 12,770 | 12,765 | 13,020 | 13,281 |
| Other Revenue | 81 | 0 | 0 | 0 | 0 | 0 | 0 | 0 |
| Total Revenue | 35,917 | 39,736 | 30,790 | 36,828 | 37,990 | 40,570 | 43,675 | 47,077 |
| Other income | 0 | 0 | 0 | 0 | 0 | 0 | 0 | 0 |
| COGS | (26,426) | (28,671) | (21,111) | (25,460) | (27,108) | (28,094) | (30,223) | (32,483) |
| SG&A | (2,930) | (3,168) | (2,977) | (3,442) | (3,614) | (4,016) | (4,193) | (4,472) |
| Other op.expenses | (163) | (160) | (153) | (171) | (176) | (243) | (218) | (235) |
| Operating profit | 6,398 | 7,737 | 6,549 | 7,755 | 7,092 | 8,215 | 9,041 | 9,886 |
| Net-interest inc./(exp.) | (2) | (23) | (2) | 38 | 99 | 130 | 130 | 130 |
| Assoc/forex/extraord./others | (11) | 826 | 128 | 557 | (225) | 132 | 40 | 40 |
| Pre-tax profit | 6,386 | 8,540 | 6,676 | 8,351 | 6,966 | 8,478 | 9,211 | 10,057 |
| Tax | (1,237) | (1,750) | (1,499) | (1,710) | (1,451) | (1,766) | (1,918) | (2,094) |
| Min. int./pref. div./others | 0 | 0 | 0 | 0 | 0 | 0 | 0 | 0 |
| Net profit (reported) | 5,149 | 6,790 | 5,176 | 6,641 | 5,515 | 6,712 | 7,293 | 7,962 |
| Net profit (adjusted) | 5,149 | 6,790 | 5,176 | 6,641 | 5,515 | 6,712 | 7,293 | 7,962 |
| EPS (reported)(TWD) | 18.765 | 24.749 | 18.867 | 24.204 | 20.101 | 24.465 | 26.580 | 29.021 |
| EPS (adjusted)(TWD) | 18.765 | 24.749 | 18.867 | 24.204 | 20.101 | 24.465 | 26.580 | 29.021 |
| EPS (adjusted fully-diluted)(TWD) | 18.764 | 24.747 | 18.866 | 24.203 | 20.087 | 24.454 | 26.567 | 29.006 |
| DPS (TWD) | 12.000 | 17.000 | 13.500 | 17.000 | 15.000 | 18.349 | 19.935 | 21.766 |
| EBIT | 6,398 | 7,737 | 6,549 | 7,755 | 7,092 | 8,215 | 9,041 | 9,886 |
| EBITDA | 7,031 | 8,531 | 7,430 | 8,642 | 7,968 | 9,074 | 9,981 | 10,899 |
Cash flow (TWDm)
| Year to 31 Dec | 2021 | 2022 | 2023 | 2024 | 2025 | 2026E | 2027E | 2028E |
|---|---|---|---|---|---|---|---|---|
| Profit before tax | 6,386 | 8,540 | 6,676 | 8,351 | 6,966 | 8,478 | 9,211 | 10,057 |
| Depreciation and amortisation | 632 | 794 | 881 | 886 | 876 | 859 | 940 | 1,012 |
| Tax paid | (1,237) | (1,750) | (1,499) | (1,710) | (1,451) | (1,766) | (1,918) | (2,094) |
| Change in working capital | (3,020) | 3,828 | (708) | (2,365) | 1,283 | (1,254) | (185) | (904) |
| Other operational CF items | 16 | 905 | (686) | (442) | (104) | (0) | 0 | 0 |
| Cash flow from operations | 2,778 | 12,318 | 4,664 | 4,720 | 7,570 | 6,317 | 8,047 | 8,070 |
| Capex | (2,490) | (1,796) | (303) | (484) | (370) | (2,480) | (2,000) | (2,000) |
| Net (acquisitions)/disposals | 5 | 0 | 46 | 93 | 0 | 0 | 0 | 0 |
| Other investing CF items | (13) | (3,011) | (1,579) | (401) | (1,497) | 0 | 0 | 0 |
| Cash flow from investing | (2,498) | (4,807) | (1,836) | (792) | (1,866) | (2,480) | (2,000) | (2,000) |
| Change in debt | 4 | 431 | (1,154) | 1,181 | (1,171) | 0 | 0 | 0 |
| Net share issues/(repurchases) | 0 | 0 | 0 | 0 | 0 | 0 | 0 | 0 |
| Dividends paid | (3,018) | (3,292) | (4,664) | (3,704) | (4,664) | (4,116) | (5,034) | (5,469) |
| Other financing CF items | 525 | (393) | (233) | (586) | (18) | 0 | 0 | 0 |
| Cash flow from financing | (2,489) | (3,254) | (6,052) | (3,109) | (5,854) | (4,116) | (5,034) | (5,469) |
| Forex effect/others | (54) | 5 | 15 | (15) | (59) | 0 | 0 | 0 |
| Change in cash | (2,264) | 4,262 | (3,209) | 804 | (209) | (279) | 1,013 | 601 |
| Free cash flow | 287 | 10,522 | 4,361 | 4,236 | 7,200 | 3,837 | 6,047 | 6,070 |
Source: FactSet, Daiwa forecasts
Eclat Textile (1476 TT): 18 August 2026
Daiwa
Financial summary continued …
Balance sheet (TWDm)
| Year to 31 Dec | 2021 | 2022 | 2023 | 2024 | 2025 | 2026E | 2027E | 2028E |
|---|---|---|---|---|---|---|---|---|
| Cash & short-term investment | 1,760 | 6,022 | 2,814 | 3,618 | 3,409 | 3,131 | 4,144 | 4,745 |
| Inventory | 8,276 | 4,625 | 4,402 | 5,522 | 5,931 | 6,120 | 6,598 | 7,084 |
| Accounts receivable | 5,209 | 4,087 | 4,967 | 6,638 | 4,817 | 6,228 | 6,121 | 6,913 |
| Other current assets | 578 | 3,621 | 5,215 | 5,730 | 7,210 | 7,210 | 7,210 | 7,210 |
| Total current assets | 15,823 | 18,355 | 17,398 | 21,508 | 21,367 | 22,689 | 24,073 | 25,951 |
| Fixed assets | 12,065 | 13,627 | 12,288 | 12,994 | 12,328 | 13,944 | 15,004 | 15,992 |
| Goodwill & intangibles | 19 | 19 | 25 | 27 | 20 | 20 | 20 | 20 |
| Other non-current assets | 1,372 | 1,362 | 2,122 | 1,337 | 1,326 | 1,326 | 1,326 | 1,326 |
| Total assets | 29,279 | 33,364 | 31,833 | 35,865 | 35,042 | 37,980 | 40,424 | 43,290 |
| Short-term debt | 1,347 | 1,778 | 624 | 1,804 | 547 | 547 | 547 | 547 |
| Accounts payable | 4,144 | 3,526 | 3,137 | 3,793 | 3,625 | 3,971 | 4,157 | 4,530 |
| Other current liabilities | 1,536 | 2,274 | 2,320 | 1,169 | 1,090 | 1,090 | 1,090 | 1,090 |
| Total current liabilities | 7,027 | 7,577 | 6,081 | 6,767 | 5,263 | 5,609 | 5,795 | 6,168 |
| Long-term debt | 1,037 | 563 | 0 | 0 | 0 | 0 | 0 | 0 |
| Other non-current liabilities | 66 | 81 | 81 | 177 | 137 | 137 | 137 | 137 |
| Total liabilities | 8,129 | 8,222 | 6,162 | 6,943 | 5,400 | 5,746 | 5,932 | 6,304 |
| Share capital | 2,744 | 2,744 | 2,744 | 2,744 | 2,744 | 2,744 | 2,744 | 2,744 |
| Reserves/R.E./others | 18,406 | 22,398 | 22,927 | 26,178 | 26,893 | 29,490 | 31,749 | 34,242 |
| Shareholders' equity | 21,149 | 25,142 | 25,671 | 28,922 | 29,637 | 32,234 | 34,492 | 36,985 |
| Minority interests | 0 | 0 | 0 | 0 | 0 | 0 | 0 | 0 |
| Total equity & liabilities | 29,279 | 33,364 | 31,833 | 35,865 | 35,037 | 37,980 | 40,424 | 43,290 |
| EV | 85,815 | 81,510 | 83,001 | 83,377 | 82,329 | 82,607 | 81,595 | 80,994 |
| Net debt/(cash) | 624 | (3,681) | (2,190) | (1,814) | (2,862) | (2,584) | (3,596) | (4,197) |
| BVPS (TWD) | 77.084 | 91.636 | 93.563 | 105.412 | 108.020 | 117.485 | 125.716 | 134.802 |
Key ratios (%)
| Year to 31 Dec | 2021 | 2022 | 2023 | 2024 | 2025 | 2026E | 2027E | 2028E |
|---|---|---|---|---|---|---|---|---|
| Sales (YoY) | 27.5 | 10.6 | (22.5) | 19.6 | 3.2 | 6.8 | 7.7 | 7.8 |
| EBITDA (YoY) | 13.4 | 21.3 | (12.9) | 16.3 | (7.8) | 13.9 | 10.0 | 9.2 |
| Operating profit (YoY) | 16.4 | 20.9 | (15.4) | 18.4 | (8.6) | 15.8 | 10.0 | 9.4 |
| Net profit (YoY) | 21.0 | 31.9 | (23.8) | 28.3 | (17.0) | 21.7 | 8.6 | 9.2 |
| Core EPS (fully-diluted) (YoY) | 21.0 | 31.9 | (23.8) | 28.3 | (17.0) | 21.7 | 8.6 | 9.2 |
| Gross-profit margin | 26.4 | 27.8 | 31.4 | 30.9 | 28.6 | 30.8 | 30.8 | 31.0 |
| EBITDA margin | 19.6 | 21.5 | 24.1 | 23.5 | 21.0 | 22.4 | 22.9 | 23.2 |
| Operating-profit margin | 17.8 | 19.5 | 21.3 | 21.1 | 18.7 | 20.3 | 20.7 | 21.0 |
| Net profit margin | 14.3 | 17.1 | 16.8 | 18.0 | 14.5 | 16.5 | 16.7 | 16.9 |
| ROAE | 25.5 | 29.3 | 20.4 | 24.3 | 18.8 | 21.7 | 21.9 | 22.3 |
| ROAA | 18.5 | 21.7 | 15.9 | 19.6 | 15.6 | 18.4 | 18.6 | 19.0 |
| ROCE | 28.7 | 30.3 | 24.4 | 27.2 | 23.3 | 26.1 | 26.7 | 27.2 |
| ROIC | 26.6 | 28.5 | 22.6 | 24.4 | 20.8 | 23.1 | 23.6 | 24.6 |
| Net debt to equity | 2.9 | n.a. | n.a. | n.a. | n.a. | n.a. | n.a. | n.a. |
| Effective tax rate | 19.4 | 20.5 | 22.5 | 20.5 | 20.8 | 20.8 | 20.8 | 20.8 |
| Accounts receivable (days) | 53.7 | 42.7 | 53.7 | 57.5 | 55.0 | 49.7 | 51.6 | 50.5 |
| Current ratio (x) | 2.3 | 2.4 | 2.9 | 3.2 | 4.1 | 4.0 | 4.2 | 4.2 |
| Net interest cover (x) | 4,206.8 | 337.2 | 3,882.0 | n.a. | n.a. | n.a. | n.a. | n.a. |
| Net dividend payout | 63.9 | 68.7 | 71.6 | 70.2 | 74.6 | 75.0 | 75.0 | 75.0 |
| Free cash flow yield | 0.3 | 12.4 | 5.1 | 5.0 | 8.5 | 4.5 | 7.1 | 7.1 |
Source: FactSet, Daiwa forecasts
Company profile
Eclat Textile (Eclat) is a technology-based Taiwanese textiles company that supplies functional and flexible knitwear fabrics, as well as sports apparel products, to a diversified client base. Its major clients include Nike, Gap (Athleta), Under Armour and Lululemon.
Eclat Textile (1476 TT): 18 August 2026
Daiwa
ESG analysis
ESG risks
| Risks | Management | Analyst comments | |
|---|---|---|---|
| G | Executive/board quality | 1 | The CEO and Chairman of Eclat are not the same individual. The Chairman leads the board and the 2 independent CEOs manage its fabric and garment divisions, respectively. The board includes 4 independent directors and 1 female member. Moreover, 3 of the board members (including the Chairman) are founding members, with more than 40 years of experience in Eclat's business, indicating strong leadership and management capability. |
| G | Capital management | 1 | Eclat has maintained its payout ratio at 64-75% over 2019-25. As it is expanding its capacity in Indonesia, we believe the current payout level is reasonable. |
| G | Related party & transaction | 1 | Eclat's garment division sources partially from its fabric division, with an internal transfer ratio of 40%. We believe this is a strong sign to its clients about the company's competitive advantages in production cost and quality. |
| S | Supply chain management | 1 | Eclat adheres to the ZDHC regulation (MRSL) and has adopted the Higg Index to evaluate its sustainability. It is also a partner of the Bluesign system. Eclat has also set up its ERP system, which could save 50k+ hours per year. To lower supplier-related risks, it adopts a decentralised procurement strategy that conducts collaborative R&D with suppliers. Its capacity allocation has expanded to different regions in the past few years, including Taiwan, Vietnam, Cambodia and Indonesia. We believe the risk-mitigation measures from the decentralised procurement strategy can offset the costs incurred from managing suppliers from various locations. |
| E | Materials sourcing & efficiency | 1 | As one of the few textile companies that have R&D capability to develop innovative products, Eclat has invested substantially in its environment-friendly products on the back of the ESG trend in the fashion industry. Also, Eclat has been increasing its recycled yarn percentage every year (2022: 17.23%) and is dedicated to improving its local-to-local sourcing ratio (2022: 85.43% in Taiwan; 45.81% in Vietnam), which saves transportation costs and energy, and lowers carbon emissions. |
Note: Management score represents a company's ability to manage/benefit from certain ESG topics. The scores range from 1 to 3, with 1 being the strongest.
Update Date: 19 May 2026
Source: Daiwa, Company
Eclat Textile (1476 TT): 18 August 2026
Daiwa