PDF 原檔:報告_Citi_AES-KY6781_20260806_original.pdf
圖片清單(已驗證 2026-08-07)
| 檔名 | size | 分類 | 親眼所見內容 |
|---|---|---|---|
報告_Citi_AES-KY6781_20260806_001.png |
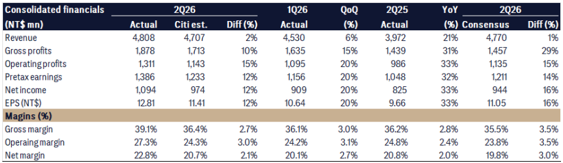
63.5KB | 真資料圖 | Figure 1「AES: 2Q26 Results Comp」數字表:2Q26 實際/Citi估/差異、1Q26 QoQ、2Q25 YoY、2026 consensus 對照;營收 NT$4,808mn、EPS NT$12.81、毛利率 39.1% |
報告_Citi_AES-KY6781_20260806_002.png |
207.2KB | 真資料圖 | Ratings and Target Price History 與 Short-Term View/Catalyst Watch 附錄圖表:2024-01 至 2026-07 評等/目標價變動紀錄(含日期、TP、收盤價),最新一筆 TP NT$1,680 |
原始內容
citivelocity.com
06 Aug 2026 09:52:51 ET │ 12 pages
Advanced Energy Solution (6781.TW)
2Q26 Beat and July Sales Affirm BBU Strength
CITI'S TAKE
AES's 2Q26 results were ahead of expectations, with net income beating our/BBG estimates by 12%/16%, primarily driven by stronger GPM. We believe the 3ppt q/q GPM expansion likely reflected a better product mix helped by more contributions of higher power BBU and improved fixedcost leverage as shipment volumes increased. The beat suggests upside risk to our/BBG full year earnings estimates. Meanwhile, record July-26 sales, +28% y/y and +2% m/m, provide further evidence of sustained BBU demand momentum. Overall, the results reinforce our positive view on the BBU sector. We also see this as a positive read-across to Dynapack AES's strong margin expansion suggests meaningful room for Dynapack's profitability to improve as its BBU sales scale, product mix shifts toward higher power products and operating leverage becomes more evident.
2Q26 results beat on stronger margins - Sales rose 21% y/y and 6% q/q to NT$4.8bn, 2% above our estimate, while net income grew 33% y/y and 20% q/q to NT$1.1bn, beating our/BBG estimates by 12%/16%. The key positive surprise was GPM, which expanded 3.0ppt q/q to 39.1%. We believe the improvement was likely driven by a better product mix, particularly a higher contribution from higher power rating BBU products, together with stronger fixed-cost leverage as shipment volume increased. The margins beat suggests potential upside risk to our and BBG full year earnings forecasts.
July-26 sales provide further evidence of robust BBU demand - Sales reached another record high of NT$1.7bn, up 28% y/y and 2% m/m, extending the sequential growth momentum seen since March. The solid monthly performance following a strong 2Q suggests that demand remains healthy.
Implications AES's strong results and solid July-26 sales reinforce our positive view on the BBU sector, supported by sustained AIDC infrastructure buildout,
Earnings Summary
| Year to 31Dec | Net Profit (NT$M) | DilutedEPS (NT$) | EPSgrowth (%) | P/E (x) | P/B (x) | ROE (%) | Yield (%) |
|---|---|---|---|---|---|---|---|
| 2024A | 2,169 | 25.39 | 10.2 | 42.9 | 6.3 | 15.7 | 1.1 |
| 2025A | 3,263 | 38.2 | 50.4 | 28.5 | 5.5 | 20.7 | 1.7 |
| 2026E | 3,959 | 46.35 | 21.3 | 23.5 | 4.5 | 21.2 | 2.1 |
| 2027E | 5,240 | 61.35 | 32.4 | 17.8 | 3.9 | 23.6 | 2.8 |
| 2028E | 6,671 | 78.09 | 27.3 | 14 | 3.3 | 25.7 | 3.5 |
Source: Powered by dataCentral
increasing BBU content and an ongoing shift toward higher-power products. The solid GPM expansion is also an encouraging read-across for Dynapack, our preferred BBU stock. It suggests meaningful room for Dynapack's profitability to improve as its
See Appendix A-1 for Analyst Certification, Important Disclosures and Research Analyst Affiliations
| Buy | |
|---|---|
| Price(06Aug2613:30) | NT$1,090.00 |
| Target price | NT$1,680.00 |
| Expected share price return | 54.1% |
| Expected dividend yield | 2.1% |
| Expected total return | 56.2% |
| MarketCap | NT$93,106M |
| US$2,885M |
Angela Hsu AC
+886-2-8726-9083 angela.hc.hsu@citi.com
BBU revenue scales and higher-power 8kW/12kW products begin contributing more meaningfully.
rigure 1. Aro: 4240 Results comp
Consolidated financials
2026
(NTS mn)
Revenue
Gross profits
Operating profits
Pretax earnings
Net income
EPS (NT$)
Magins (%)
Gross margin
Operaing margin
Net margin
Actual
1,094
12.81
39.1%
27.3%
22.8%
Citi est.
974
11.41
36.4%
24.3%
20.7%
Diff (%)
12%
12%
2.7%
3.0%
2.1%
1Q26
Actual
909
10.64
36.1%
24.2%
20.1%
Q0Q
(%)
20%
20%
3.0%
2.7%
2025
Actual
3,972
1,439
986
1,048
825
9.66
36.2%
24.8%
20.8%
€ 2M6 Citiceoun Ine Mo radictribution without Citiceoun' writton normiccion
3.1%
YoY
2026
(%) Consensus
21%
31%
33%
32%
33%
33%
2.8%
2.0%
2.4%
4,770
1,457
1,135
1,211
944
11.05
35.5%
23.8%
19.8%
Diff (%)
1%
29%
15%
14%
16%
16%
3.5%
3.0%
3.5%
Figure 1. AES: 2Q26 Results Comp
© 2026 Citigroup Inc. No redistribution without Citigroup's written permission.
Source: Citi Research, Citi Research Estimates, Company Reports, Bloomberg
Advanced Energy Solution
Valuation
Our target price of NT$1,680 is based on 27x 2026E EPS on par with its historical average since listing and supported by a 2025-28E earnings CAGR of 27%. We use 2027E as the year of valuation base as we think 2027E can better reflect its earnings power after the commercializarion of HVDC products.
Risks
Key downside risks to our earnings forecasts that could prevent the shares from reaching our target price include: 1) slowerthan-expected end demand from e-Bikes post the pandemic and volaitlity in cloud capex deployment that could impact datacenter BBU sales; 2) component supply constraints/logistics challenges, which could lead to slower-than-expected shipment and top-line momentum; and 3) peer competition, which could impact sales growth and margins negatively, in our view.
Advanced Energy Solution (6781.TW)
Analyst: Angela Hsu
If you are visually impaired and would like to speak to a Citi representative regarding the details of the graphics in this document, please call USA 1-888-500-5008 (TTY: 711), from outside the US +1-210-677-3788
Date
Covered sonomaniasonomanii isonominite
Appendix A-1
2 11-Mar-24 07:08:28
1
*870.00
731.00
E 15-Nov-24 07:46:33