PDF 原檔:報告_Citi_大立光3008_20260709_original.pdf
圖片清單(已驗證 2026-07-13)
| 檔名 | size | 分類 | 親眼所見內容 |
|---|---|---|---|
_002.png |
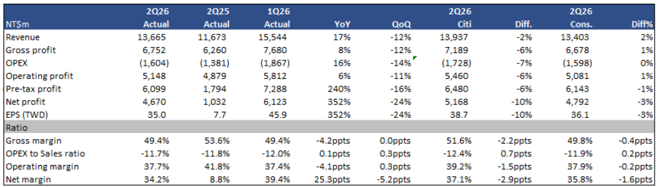
76127 | 真資料圖 | 2Q26 財務比較表:Largan 1Q26/2Q25/2Q26 Actual 營收、毛利、OPEX、營業利益、稅前利益、淨利、EPS 與 Citi/市場一致預期比較(YoY/QoQ/差異%) |
_003.png |
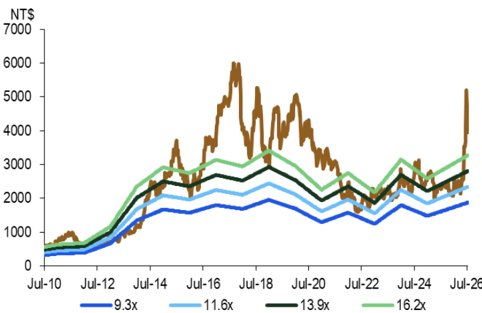
65000 | 真資料圖 | Largan Forward P/E band 圖(2010-2026),股價走勢疊加 9.3x/11.6x/13.9x/16.2x 四條本益比線 |
_004.png |
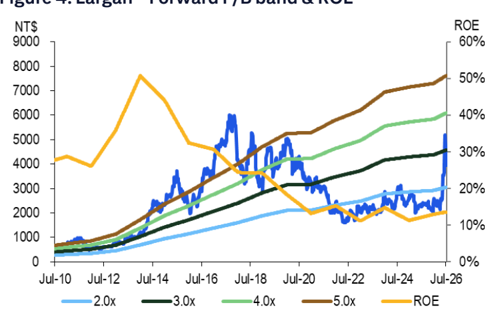
71556 | 真資料圖 | Largan Forward P/B band & ROE 圖(2010-2026),股價走勢疊加 2.0x/3.0x/4.0x/5.0x 本淨比線與 ROE 曲線 |
_005.png |
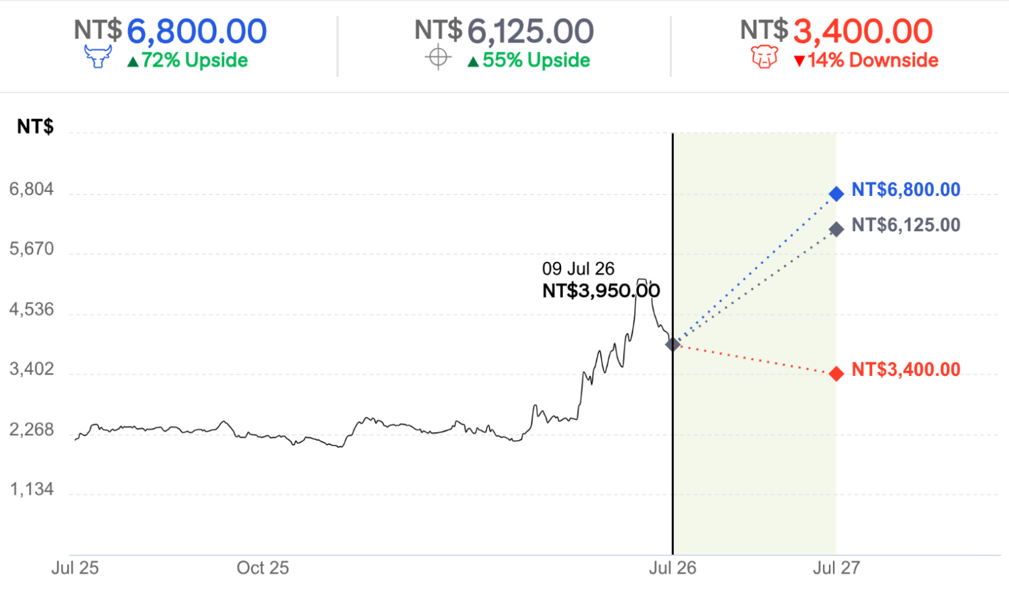
102574 | 真資料圖 | 90 天短線 Bull/Bear 情境圖:現價 NT$3,950,Bull NT$6,800(+72%)、Citi TP NT$6,125(+55%)、Bear NT$3,400(-14%) |
_006.png |
225520 | 真資料圖 | 兩張圖:Largan 評等與目標價三年歷史表(2023-07~2026-06,12 筆紀錄,最新一筆 2026-06-08 TP NT$5,325)+ Catalyst Watch 短線觀點紀錄圖 |
_001.png(18620B,<40KB)未逐張驗證,依規則預設略過。
原始內容
(RIC: 3008.1W, BB: 3008 11)
TWD
5,000
4,500
4,000
3,500
3,000
2,500
2,000
1,500
Prepared for Kevin Lu
09 Jul 2026 07:52:49 ET │ 17 pages
Sep
Dec
Mar
Jun
Largan Precision (3008.TW)
Phone camera upgrade + Fiber Array upside
CITI'S TAKE
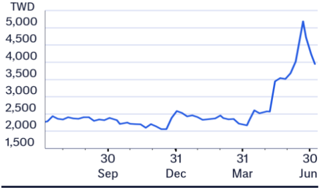
Largan's 2Q26 earnings at NT$4.7bn (down 24% QoQ, up 352% YoY) was inline with market expectation but lower than our estimate due to smartphone model transition. GM/OPM at 49.4%/37.7% in 2Q26, which is flat QoQ despite smaller scale. The management guides sequentially MoM revenue growth in July/Aug and seeing new flagship smartphone order flow resilient YoY in 2H26. During the earnings call, Largan expects its new business in CPO Fiber Array is ready for sampling in next few weeks and the mass volume production could start in 2H27 at earliest, if it gets certification. Along with new phone camera lens upgrade into next year, we see earnings upside. Reiterate Buy and raise TP to NT$6,125.
Fiber Array progress better than expected -Although Corning's GlassBridge has attracted significant industry attention, its primary value proposition appears to be enabling Edge Coupler (EC) architectures rather than today's dominant Grating Coupler (GC) platforms. However, most commercial CPO and NPO products expected over the next two to three years are still likely to adopt GC because it supports wafer-level optical testing, provides greater packaging tolerance and offers a more mature manufacturing ecosystem. For Largan, this suggests that the near-term opportunity remains centered on GC-based optical engines, leveraging its expertise in high-density and precision alignment Fiber Arrays. Over the longer term, if the industry gradually transitions toward Edge Coupler-based CPO platforms, the evolution represents a technology upgrade rather than a disruption of the existing FAU ecosystem. Largan seems to be confident about its Fiber array opportunity, and the pilot run production line will be ready in 3Q26 with mass volume production in 2H27 at earliest, earlier than our previous estimate in 2028.
Major camera lens upgrade likely in 2027 -Largan is also seeing potential phone camera upgrade into 2027 following variable aperture this year. Largan is working on periscope inner zooming solution, and we expect to see further ASP upgrade given more complex optics and mechanism design. Despite saturated smartphone market outlook, we believe Largan ' s market share remains intact considering potential spec upgrade cycle.
Better outlook ahead -While we see muted smartphone lens growth in 2026, we see better outlook for 2027 onward. We lift our 2027/2028 earnings projection by 12%/14% and reiterate our Buy with TP higher at NT$6,125 (25x of our 2027/28 EPS).
Earnings Summary
| Year to 31Dec | Net Profit (NT$M) | DilutedEPS (NT$) | EPSgrowth (%) | P/E (x) | P/B (x) | ROE (%) | Yield (%) |
|---|---|---|---|---|---|---|---|
| 2024A | 25,915 | 194.17 | 44.8 | 20.3 | 2.8 | 14.8 | 2.2 |
| 2025A | 21,275 | 159.4 | -17.9 | 24.8 | 2.8 | 11.3 | 2 |
| 2026E | 24,966 | 187.05 | 17.3 | 21.1 | 2.7 | 12.9 | 2.4 |
| 2027E | 28,696 | 215 | 14.9 | 18.4 | 2.5 | 14.1 | 2.7 |
| 2028E | 36,477 | 273.3 | 27.1 | 14.5 | 2.3 | 16.4 | 3.5 |
Source: Powered by dataCentral
See Appendix A-1 for Analyst Certification, Important Disclosures and Research Analyst Affiliations.
| n Buy Short-Term View: Upside Price (09 Jul 2613:30) | NT$3,950.00 |
|---|---|
| Target price | NT$6,125.00↑ |
| Expected share price return | 55.1% |
| Expected dividend yield | 2.0% |
| Expected total return | 57.1% |
| MarketCap | NT$516,653M |
| US$16,175M |
Price Performance
(RIC: 3008.TW, BB: 3008 TT)
Laura (Chia Yi) Chen AC
+886-2-8726-9090
laura.cy.chen@citi.com
Jack Chen
+886-2-8726-9091
jack1.chen@citi.com
Nicholas Lai +886-2-8726-9093
nicholas.lai@citi.com
Prepared for Kevin Lu
| 3008.TW:Fiscalyearend31-Dec | Price: NT$3,950.00; TP: NT$6,125.00; MarketCap:NT$516,653m; Recomm:Buy | Price: NT$3,950.00; TP: NT$6,125.00; MarketCap:NT$516,653m; Recomm:Buy | Price: NT$3,950.00; TP: NT$6,125.00; MarketCap:NT$516,653m; Recomm:Buy | Price: NT$3,950.00; TP: NT$6,125.00; MarketCap:NT$516,653m; Recomm:Buy | Price: NT$3,950.00; TP: NT$6,125.00; MarketCap:NT$516,653m; Recomm:Buy | ||||||
|---|---|---|---|---|---|---|---|---|---|---|---|
| Profit&Loss(NT$m) | 2024 | 2025 | 2026E | 2027E | 2028E | Valuation ratios | 2024 | 2025 | 2026E | 2027E | 2028E |
| Sales revenue | 59,458 | 61,148 | 66,496 | 86,090 | 115,733 | PE(x) | 20.3 | 24.8 | 21.1 | 18.4 | 14.5 |
| Cost of sales | -28,248 | -30,311 | -32,109 | -43,039 | -58,936 | PB(x) | 2.8 | 2.8 | 2.7 | 2.5 | 2.3 |
| Gross profit | 31,209 | 30,837 | 34,387 | 43,051 | 56,797 | EV/EBITDA(x) | 13.0 | 12.5 | 10.9 | 8.8 | 6.5 |
| Gross Margin (%) | 52.5 | 50.4 | 51.7 | 50.0 | 49.1 | FCFyield (%) | 3.0 | 1.9 | 6.6 | 6.4 | 7.8 |
| EBITDA(Adj) | 29,617 | 30,526 | 34,679 | 40,958 | 52,210 | Dividend yield (%) | 2.2 | 2.0 | 2.4 | 2.7 | 3.5 |
| EBITDAMargin(Adj) (%) | 49.8 | 49.9 | 52.2 | 47.6 | 45.1 | Payout ratio (%) | 44 | 50 | 50 | 50 | 50 |
| Depreciation | -5,585 | -6,968 | -8,175 | -9,472 | -10,974 | ROE(%) | 14.8 | 11.3 | 12.9 | 14.1 | 16.4 |
| Amortisation | 0 | 0 | 0 | 0 | 0 | Cashflow(NT$m) | 2024 | 2025 | 2026E | 2027E | 2028E |
| EBIT (Adj) | 24,032 | 23,558 | 26,504 | 31,486 | 41,235 | EBITDA | 29,617 | 30,526 | 34,679 | 40,958 | 52,210 |
| EBIT Margin (Adj) (%) | 40.4 | 38.5 | 39.9 | 36.6 | 35.6 | Working capital | -4,417 | -6,864 | 9,246 | 1,620 | 296 |
| Net interest | 4,404 | 4,259 | 3,670 | 3,600 | 3,600 | Other | 2,178 | -1,998 | -1,398 | -2,790 | -4,759 |
| Associates | 0 | 3 | 151 | 200 | 200 | Operating cashflow | 27,378 | 21,664 | 42,527 | 39,788 | 47,747 |
| Non-Op/Except/Other Adj | 3,738 | -1,919 | 646 | 280 | 280 | Capex | -11,385 | -11,504 | -7,658 | -5,808 | -6,726 |
| Pre-tax profit | 32,174 | 25,900 | 30,971 | 35,566 | 45,315 | Net acq/disposals | 1,369 | 0 | -150 | -200 | -200 |
| Tax | -5,963 | -4,340 | -5,865 | -6,870 | -8,839 | Other | -5,514 | 8,798 | -480 | 0 | 0 |
| Extraord./Min.Int./Pref.div. | -296 | -285 | -140 | 0 | 0 | Investing cashflow | -15,531 | -2,707 | -8,288 | -6,008 | -6,926 |
| Reported net profit | 25,915 | 21,275 | 24,966 | 28,696 | 36,477 | Dividends paid | -10,811 | -11,412 | -10,680 | -12,533 | -14,405 |
| Net Margin (%) | 43.6 | 34.8 | 37.5 | 33.3 | 31.5 | Financing cashflow | -5,679 | -16,674 | -21,133 | -12,533 | -14,405 |
| CoreNPAT | 25,915 | 21,275 | 24,966 | 28,696 | 36,477 | Net change in cash | 6,168 | 2,283 | 13,106 | 21,247 | 26,416 |
| Per share data | 2024 | 2025 | 2026E | 2027E | 2028E | Free cashflow to s/holders | 15,993 | 10,160 | 34,869 | 33,980 | 41,021 |
| Reported EPS($) | 194.17 | 159.40 | 187.05 | 215.00 | 273.30 | ||||||
| Core EPS($) | 194.17 | 159.40 | 187.05 | 215.00 | 273.30 | ||||||
| DPS($) | 85.50 | 80.02 | 93.90 | 107.93 | 137.20 | ||||||
| CFPS($) | 205.13 | 162.32 | 318.63 | 298.11 | 357.74 | ||||||
| FCFPS($) | 119.83 | 76.12 | 261.25 | 254.59 | 307.35 | ||||||
| BVPS($) | 1,389.00 | 1,430.06 | 1,459.41 | 1,580.51 | 1,745.88 | ||||||
| Wtdavgordshares(m) | 133 | 133 | 133 | 133 | 133 | ||||||
| Wtdavgdiluted shares (m) | 133 | 133 | 133 | 133 | 133 | ||||||
| Growthrates | 2024 | 2025 | 2026E | 2027E | 2028E | ||||||
| Sales revenue (%) | 21.7 | 2.8 | 8.7 | 29.5 | 34.4 | ||||||
| EBIT (Adj) (%) | 35.0 | -2.0 | 12.5 | 18.8 | 31.0 | ||||||
| CoreNPAT(%) | 44.8 | -17.9 | 17.3 | 14.9 | 27.1 | ||||||
| CoreEPS(%) | 44.8 | -17.9 | 17.3 | 14.9 | 27.1 | ||||||
| BalanceSheet(NT$m) | 2024 | 2025 | 2026E | 2027E | 2028E | ||||||
| Cash&cashequiv. | 113,658 | 115,942 | 129,048 | 150,295 | 176,711 | ||||||
| Accounts receivables | 10,360 | 10,462 | 14,992 | 23,469 | 30,646 | ||||||
| Inventory | 5,733 | 6,713 | 7,619 | 11,928 | 15,575 | ||||||
| Net fixed &other tangibles | 46,936 | 51,472 | 50,955 | 47,291 | 43,043 | ||||||
| Goodwill &intangibles | 0 | 0 | 0 | 0 | 0 | ||||||
| Financial &other assets | 39,839 | 36,198 | 41,717 | 56,651 | 69,325 | ||||||
| Total assets | 216,527 | 220,787 | 244,331 | 289,634 | 335,300 | ||||||
| Accounts payable | 1,855 | 1,728 | 2,471 | 5,120 | 6,288 | ||||||
| Short-term debt | 203 | 0 | 0 | 0 | 0 | ||||||
| Long-term debt | 0 | 0 | 0 | 0 | 0 | ||||||
| Provisions &other liab | 29,081 | 28,191 | 47,075 | 73,565 | 95,993 | ||||||
| Total liabilities | 31,139 | 29,919 | 49,547 | 78,686 | 102,281 | ||||||
| Shareholders' equity | 185,388 0 | 190,868 | 194,785 | 210,948 | 233,019 | ||||||
| Minority interests | 0 | 0 194,785 | 0 | 0 | |||||||
| Total equity | 185,388 | 190,868 -115,942 | 210,948 | 233,019 | |||||||
| Net debt (Adj) | -113,455 | -129,048 | -150,295 | -176,711 | |||||||
| Net debt to equity (Adj) (%) | -61.2 | -60.7 | -66.3 | -71.2 | |||||||
| For definitions of the items in this table, | please click here. | -75.8 |
Figure 1. Largan - <22o result comparison
2026
NTSm
Revenue
Gross profit
OPEX|
Operating profit
Pre-tax profit
Net profit
EPS (TWD)
Ratio
Gross margin
OPEX to Sales ratio
Operating margin
Net margin
1Q26
5,812
6,123
7,288
45.9
49.4%
-12.0%
37.4%
39.4%
2025
4,879
1,794
1,032
7.7
53.6%
-11.8%
41.8%
8.8%
YoY
17%
8%
16%
6%
240%
352%
352%
-4.2ppts
0.1ppts
-4.1ppts
25.3ppts
5,148
6,099
4,670
35.0
49.4%
-11.7%
37.7%
34.2%
QOQ
-12%
-12%
-14%
-11%
-16%
-24%
-24%
0.0ppts
0.3ppts
0.3ppts
-5.2ppts
C 2026 Citigroun Inc. No redistribution without Citigroun's written nermission.
Prepared for Kevin Lu
2026
Citi
13,937
7,189
(1,728)
5,460
5,168
6,480
38.7
51.6%
-12.4%
Diff.
-2%
-6%
-7%
-6%
-6%
-10%
-10%
-2.2ppts
0.7ppts
2026
Cons.
13,403
(1,598)
6,678
5,081
4,792
6,143
36.1
49.8%
-11.9%
Diff%
2%
1%
0%
1%
-1%
-3%
-3%
-0.4ppts
0.2ppts
Negative impact from GlassBridge? 2-3 years Roadmap: Grating Couplers Remain as the Primary Production Choice
Largan's share price corrected by more than 20% since media reports Corning's GlassBridge technology (TechNews, 7/1) will be a disruption for CPO Fiber Array. Corning's GlassBridge is fundamentally a package-side optical interface that utilizes embedded glass waveguides to couple light into the PIC. This architecture naturally aligns with Edge Couplers, where light propagates horizontally from the fiber through the glass waveguide into the silicon waveguide. While GlassBridge has the potential to simplify optical packaging and improve serviceability, its advantages are expected to become more meaningful if the industry gradually transitions from Grating Couplers (GC) toward Edge Coupler-based architectures in future generations.
From Largan's perspective, most commercial CPO and NPO products expected over the next two to three years are still likely to adopt Grating Couplers (GC). GC enables wafer-level optical testing, offers greater packaging tolerance, and simplifies manufacturing during the industry's initial commercialization phase. As a result, the near-term supply chain-including Fiber Arrays, Micro Lens Arrays and PMLA-will continue to be largely optimized for GC-based optical engines.
In the next 2-3 years, Largan's opportunities remain centered on GC-based platforms through Fiber Array technologies (see our upgrade report of Largan Precision (3008.TW) - Addressing CPO Opportunity, Semiconductor-Level Precision Becomes Key Advantage for Largan; Upgrade to Buy). Thanks to its better optics precision and alignment technology, Largan seems to be confident about its Fiber array opportunity, and the pilot run production line will be ready in 3Q26 with mass volume production in 2H27 at earliest, earlier than our previous estimate in 2028.
Better outlook ahead
While we see muted smartphone lens growth in 2026, we see better outlook for 2027 onward. Largan is seeing potential phone camera upgrade into 2027 following variable aperture this year. The company is working on periscope inner zooming solution, and we expect to see further ASP upgrade given more complex optics and mechanism design. Despite saturated smartphone market outlook, we believe Largan's market share remains intact considering potential spec upgrade cycle. We lift our 2027/2028 earnings projection by 12%/14% and reiterate our Buy with TP NT$6,125 (25x of our 2027/28 EPS, methodology unchanged)
Figure 1. Largan - 2Q26 result comparison
© 2026 Citigroup Inc. No redistribution without Citigroup's written permission.
Source: Citi Research, Bloomberg
Prepared for Kevin Lu
Figure 2. Largan - Estimates Revisions
| 2026E | 2026E | 2026E | 2027E | 2027E | 2027E | 2028E | 2028E | 2028E | |
|---|---|---|---|---|---|---|---|---|---|
| (NT$mn) | New | Old | Chg. | New | Old | Chg. | New | Old | Chg. |
| Sales | 66,496 | 67,640 | -2% | 86,090 | 74,947 | 15% | 115,733 | 100,546 | 15% |
| Gross profit | 34,387 | 35,073 | -2% | 43,051 | 37,691 | 14% | 56,797 | 49,080 | 16% |
| Opex | (7,884) | (8,107) | -3% | (11,565) | (10,078) | 15% | (15,562) | (13,516) | 15% |
| Operating profit | 26,504 | 26,966 | -2% | 31,486 | 27,614 | 14% | 41,235 | 35,564 | 16% |
| Pre-tax profit | 30,971 | 31,502 | -2% | 35,566 | 31,694 | 12% | 45,315 | 39,644 | 14% |
| Net income | 24,965 | 25,577 | -2% | 28,696 | 25,579 | 12% | 36,476 | 31,910 | 14% |
| EPS(NT$) | 187.1 | 191.6 | -2% | 215.0 | 191.6 | 12% | 273.3 | 239.1 | 14% |
| Gross margin | 51.7 | 51.9 | -0.1ppts | 50.0 | 50.3 | -0.3ppts | 49.1 | 48.8 | 0.3ppts |
| Opexratio | (11.9) | (12.0) | -0.1ppts | (13.4) | (13.4) | 0.0ppts | (13.4) | (13.4) | 0.0ppts |
| Operating margin | 39.9 | 39.9 | 0.0ppts | 36.6 | 36.8 | -0.3ppts | 35.6 | 35.4 | 0.3ppts |
| Net margin | 37.5 | 37.8 | -0.3ppts | 33.3 | 34.1 | -0.8ppts | 31.5 | 31.7 | -0.2ppts |
© 2026 Citigroup Inc. No redistribution without Citigroup's written permission.
Source: Citi Research
Key analyst meeting takeaway
- n Fiber Array (FA) Sample Status: Largan expects to complete customer sample shipments for its Fiber Array (FA) products this month. Customer evaluation could be completed within 2 weeks to 1 month, depending on qualification progress.
- n Commercialization Progress: The company currently has one customer that has entered the commercialization stage. Other customer projects remain at the proof-of-concept (POC) stage.
- n Mass Production Timeline: The first pilot production line is expected to be completed by the end of 3Q this year. After validating the pilot line, Largan plans to replicate additional production lines. Commercial mass production is expected to be ready around mid-2027, subject to yield improvement.
- n Current Product Portfolio: Largan's current optical product portfolio includes Fiber Array (FA) and Photonic Micro Lens Array (PMLA), both targeting future CPO applications.
- n NPO vs. CPO: Management noted that NPO has relatively lower optical precision requirements compared with CPO and therefore is not the company's primary development focus. Largan is prioritizing products designed specifically for future CPO architectures.
- n GlassBridge View: According to management, Corning's GlassBridge is primarily designed for Edge Coupling (EC) architectures. Today's silicon photonics ecosystem is divided between Grating Coupling (GC) and Edge Coupling (EC), with customers supporting both approaches. The company believes GC will remain the dominant production technology in the near term, and therefore continues to develop products according to the current market roadmap.
Figure 3. Largan - Forward P/E band
NT$
7000
6000
5000
4000
3000
2000
1000
0
-
9.3x
-
11.6x
— 13.9x
- 16.2x
© 2026 Citigroup Inc. No redistribution without Citigroup's written permission.
Figure 4. Largan - Forward P/B band & ROE
NT$
9000
8000
7000
6000
5000
4000
ROE
60%
40%
30%
- n GC vs. EC Outlook: Management does not expect the industry to migrate entirely toward Edge Couplers. Even if EC adoption increases over time, Grating Couplers are expected to maintain a significant market share, potentially remaining larger than EC for the foreseeable future. 0%
- n Impact on Fiber Arrays: Importantly, management emphasized that Fiber Arrays will continue to be required even under Edge Coupler architectures, suggesting that GlassBridge does not eliminate the need for Fiber Arrays, but rather changes the optical interface architecture.
- n PMLA Strategy: Largan indicated that it already has a feasible PMLA solution. However, management is still evaluating whether this approach can compete effectively against semiconductor-based or quartz/glass optical solutions. Therefore, the company's primary focus at this stage remains Fiber Array products.
- n Revenue Contribution: Management does not expect meaningful revenue contribution by the end of this year or early next year, reflecting the early stage of customer qualification and production ramp.
- n Capacity Expansion: Following successful pilot production verification, capacity expansion will depend on customer demand and qualification progress. Production line replication is expected to be relatively straightforward after process validation.
- n Product Economics: Due to the use of specialized optical materials and precision manufacturing processes, management expects future Fiber Array products to command relatively high average selling prices (ASP).
- n Major camera lens upgrade likely in 2027: Largan is also seeing potential phone camera upgrade into 2027 following variable aperture this year. Largan is working on periscope inner zooming solution and expects to see further ASP upgrade given more complex optics and mechanism design.
Figure 3. Largan - Forward P/E band
Prepared for Kevin Lu
Figure 4. Largan - Forward P/B band & ROE
© 2026 Citigroup Inc. No redistribution without Citigroup's written permission. Source: Citi Research, company data
© 2026 Citigroup Inc. No redistribution without Citigroup's written permission. Source: Citi Research, company data
NT$mn
Net sales
Gross profit
OPEX
Operating profit
Total Non-OP
Pre-tax profit
Income tax
Net profit
EPS
Margins (%)
Gross profit
OPEX to Sales Ratio
Operating profit
Total Non-OP
Pre-tax profit
Net profit
Y/Y (%)
Net sales
Gross profit
Operating profit
Pre-tax profit
Net profit
Q/Q(%)
Net sales
Gross profit
Operating profit
Pre-tax profit
Net profit
Prepared for Kevin Lu
10,26
15,544
7,680
1,867
5,812
1,476
7,288
1Q25
1,878
6,086
1,630
7,716
2Q25
3Q25
1,381 2,088
4,879 6,265
(3,085)
1,890
1,794
8,155
4Q25
17,219
1,932
6,329
1,907
8,236
738
1,112
996
Figure 5. Largan - Forecast Summary
48.3
7.7
45.9
2026
13,665
6,752
1,604
5,148
3Q26E
17,744
9,012
2,165
6,847
951
1,020
6,099
7,867
1,342 1,260
4,670
6,607
35.0
4Q26E
19,543
10,944
2,248
8,697
1,020
9,717
2,151
7,566
56.7
1Q27E
15,577
7,844
2,134
5,710
1,020
6,730
1,243
5,488
41.1
2027E 3027E 4027E
15,674
24,246 30,594
8,088
2,100
5,987
1,020
7,007
12,378
14,741
3,201
4,130
9,178
1,020
10,198
10,611
1,020
11,631
1,419
1,634
2,575
5,588 8,564 9,056
41.9
53.0
| 54.6 | 53.6 | 47.2 | 48.0 | 49.4 | 49.4 | 50.8 | 56.0 | 50.4 | 51.6 | 51.1 | 48.2 | 50.4 | 51.7 | 50.0 | 49.1 |
|---|---|---|---|---|---|---|---|---|---|---|---|---|---|---|---|
| 12.9 | 11.8 | 11.8 | 11.2 | 12.0 | 11.7 | 12.2 | 11.5 | 13.7 | 13.4 | 13.2 | 13.5 | 11.9 | 11.9 | 13.4 | 13.4 |
| 41.8 | 35.4 | 36.8 | 31.4 | 37.7 | 38.6 | 44.5 | 36.7 | 38.2 | 37.9 | 34.7 | 38.5 | 39.9 | 36.6 | 35.6 | |
| 41.7 11.2 | (26.4) | 10.7 | 11.1 | 9.5 | 7.0 | 5.7 | 5.2 | 6.5 | 6.5 | 4.2 | 3.3 | 3.8 | 6.7 | 4.7 | 3.5 |
| 52.9 | 15.4 | 46.1 | 47.8 | 46.9 | 44.6 | 44.3 | 49.7 | 43.2 | 44.7 | 42.1 | 38.0 | 42.4 | 46.6 | 41.3 | 39.2 |
| 44.2 | 8.8 | 40.1 | 39.0 | 39.4 | 34.2 | 37.2 | 38.7 | 35.2 | 35.7 | 35.3 | 29.6 | 34.8 | 37.5 | 33.3 | 31.5 |
| 28.9 | 6.3 | (6.7) | (5.4) | 6.6 | 17.1 | 0.4 | 13.5 | 0.2 | 14.7 | 36.6 | 56.5 | 2.8 | 8.7 | 29.5 | 34.4 |
| 43.2 | 17.8 | (12.2) | (23.6) | (3.6) | 7.9 | 7.9 | 32.5 | 2.1 | 19.8 | 37.4 | 34.7 | (1.2) | 11.5 | 25.2 | 31.9 |
| 53.7 | 25.4 | (19.7) | (24.5) | (4.5) | 5.5 | 9.3 | 37.4 | (1.8) | 16.3 | 34.0 | 22.0 | (2.0) | 12.5 | 18.8 | 31.0 |
| 3.9 | (69.1) | 3.9 | (25.7) | (5.6) 240.0 | (3.5) | 18.0 | (7.7) | 14.9 | 29.6 | 19.7 | (19.5) | 19.6 | 14.8 | 27.4 | |
| 5.4 | (77.1) | 6.8 | (22.5) | (5.0) 352.5 | (6.7) | 12.6 | (10.4) | 19.7 | 29.6 | 19.7 | (17.9) | 17.3 | 14.9 | 27.1 | |
| (19.9) | (19.9) | 51.4 | (2.6) | (9.7) | (12.1) | 29.8 | 10.1 | (20.3) | 0.6 | 54.7 | 26.2 | ||||
| (26.4) | (21.4) | 33.4 | (1.1) | (7.0) | (12.1) | 33.5 | 21.4 | (28.3) | 3.1 | 53.1 | 19.1 | ||||
| (27.4) | (19.8) 28.4 | 1.0 | (8.2) | (11.4) | 33.0 | 27.0 | (34.3) | 4.9 | 53.3 | 15.6 | |||||
| (76.8) | 354.6 | 1.0 | (11.5) | (16.3) | 29.0 | 23.5 | (30.7) | 4.1 | 45.5 | 14.1 | |||||
| (25.7) | (84.0) 586.0 | (5.1) | (8.9) (23.7) | 41.5 | 14.5 | (27.5) | 1.8 | 53.3 | 5.7 | ||||||
| @ 2026 Citiornun Inc No redistribution without Citioroun's written nermission |
© 2026 Citigroup Inc. No redistribution without Citigroup's written permission.
Source: Citi Research, company data
64.2
67.9
49.5
50.3
2025
61,148
30,837
7,279
23,558
2,342
25,900
4,340
2026E
66,496
34,387
7,884
26,504
4,467
30,971
5,865
21,275
24,965
159.4
187.1
2027E 2028E
86,090
11,565
15,562
41,235
31,486
4,080
4,080
35,566
45,315
6,870
8,839
28,696 36,476
215.0
273.3
Prepared for Kevin Lu
Adding Upside 90-Day Short-Term View on Largan Precision (3008.TW)
Direction:
Upside
Duration:
Within 90 Days
Category:
Thematic driven
We see Largan's share price to be supported by its resilient sales performance in the coming months and any positive development in its CPO business should also provide further upside support.
NT$
6,804
5,670
4,536
3,402
2,268
1,134
Jul 25
472% Upside
NT$ 6,125.00
4 55% Upside
NT$ 3,400.00
Bull/Bear: Largan Precision (3008.TW)
• Based on 28x PER
BASE Assumptions
- Overall GM >48% in 2026-28E
- Stable share in lens market with steady lens upgrade trend
BEAR Assumptions
• Lower than expected UTR or worse than expected product mix
- Losing significant shares in lens market
• Based on 14x PER
Prepared for Kevin Lu v14% Downside
Prepared for Kevin Lu
Largan Precision
Company description
Largan is a plastic/glass/hybrid lens supplier in Taiwan with end-applications including phone cameras, DSCs, MFPs, and tablets. More than 80% of its revenue is driven by phone camera lenses.
Investment strategy
We rate Largan a Buy as we expect its core iPhone business to remain resilient and its co-packaged optics (CPO) development to provide strong upside potential in the longer term. We believe Largan could be a long-term winner in the lens market driven by: 1) its technology leadership; 2) intellectual property (IP) protection; and 3) higher yield vs. competitors. In the longer term, we believe spec migration could keep Largan ahead of competitors.
Valuation
Our target price of NT$6,125 for Largan shares is based on 25x 2027/28E EPS, at the high end of its 5-year historical PER, which we think is justified as we expect its early engagement in the CPO business to provide a strong longterm growth opportunity. Our target multiple is lower than multiples for its CPO peers, considering Largan's development in the CPO business is in the early stage compared to other CPO players in the Taiwan supply chain.
Risks
Key downside risks include: 1) weaker smartphone demand or replacement demand, and in particular, demand headwinds for certain key clients; 2) longer learning curve and slower ramp of the yield rate; 3) slower spec migration; and 4) slower development in CPO business. Any of these risk factors could cause the shares to deviate from our target price.
If you are visually impaired and would like to speak to a Citi representative regarding the details of the graphics in this document, please call USA 1-888-500-5008 (TTY: 711), from outside the US +1-210-677-3788