PDF 原檔:報告_大和_瑞昱2379_20260512_original.pdf
原始內容
Realtek Semiconductor (2379 TT)
Target price:
TWD615.00 (from TWD575.00)
Share price (12 May):
TWD555.00
|
Up/downside:
+10.8%
When uncertainty overshadows reality?
- Likely a prolonged pre-stocking on supply-chain issues …
- … yet demand rebalancing to be pushed back, not pushed out
- Reaffirming our Buy (1) call with a higher 12M TP of TWD615
What's new: Following our results memo , we leave our forecasts little changed for Realtek to reflect its latest business dynamics. We expect a prolonged demand pre-stocking for a stronger 1H26 revenue build on customers' lingering concerns over supply-chain uncertainties. This counter-seasonal print should, however, result in a deeper 2H26 correction on demand rebalancing, when customers destock to manage inventory amid likely deteriorated consumer demand on commodity price hikes. That said, we reaffirm our Buy (1) rating on valuation grounds as this likely correction should be seasonal and already in the price. We remain positive on Realtek's structural outlook riding on the multi-G (gigabits/second) bandwidth upgrade cycles across wireless and wireline communications.
What's the impact: Forecast revisions. We lower our 2H26E revenue for Realtek with a below-seasonal print to reflect likely a demand rebalancing, after it enjoys counter-seasonal 1H26E on customers' restocking and prestocking - an anti-seasonal pattern similar to that of 2025 ( Upgrading: turnaround around the corner , 10 March). Net of the rebalancing effect, we leave our 2026 forecasts little changed. We are now modelling a higher gross-margin trajectory to factor in the better product mix and Realtek's bargaining power of partially passing rising material and manufacturing costs on to its customers. In this note, we introduce our 2028 forecasts with an EPS of c.TWD40 for a 13% CAGR over 2025-28E.
Rebalancing pushed back, not pushed out. In our sector update ( Game over? Not so soon but … , 30 March), we flagged our view on deteriorated consumer demand across the PC and smartphone segments due to commodity price hikes that hurt consumer purchases. We stick with this view and continue to see a likely demand rebalancing at Realtek, despite the timing now being pushed back by one quarter to 3Q26E. That said, we believe the potential correction in 2H26E is seasonal and poses no threat to Realtek's structural business. After two years of anti-seasonal performance, we still expect its EPS YoY growth to turn positive from 2Q26 and sustain the momentum into 2028, supported by the multi-year, multi-G bandwidth upgrade cycle across wireline and wireless communications.
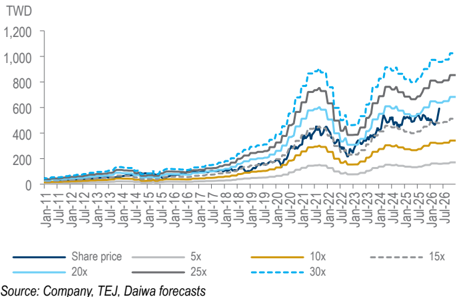
What we recommend: Given our forecast revisions, we raise our 12M TP for Realtek to TWD615 (previous: TWD575), as we fine-tune our 4-quarter forward PER target to 19x, from 18x, to capture its expanded YoY EPS growth after the turnaround in 2Q26E. We reaffirm our Buy (1) rating with key downside risk of commodity price hikes leading to worse-than-expected consumer demand resulting in a choppy earnings rebound.
How we differ: Our 2027-28E EPS are 1-12% below the consensus, likely on our deeper rebalancing effect that lowers the forecasting trajectory.
Rick Hsu (886) 2 8758 6261 rick.hsu@daiwacm-cathay.com.tw
Forecast revisions (%)
| Year to 31 Dec | 26E | 27E | 28E |
|---|---|---|---|
| Revenue change | 1.4 | (0.9) | n.a. |
| Net profit change | 2.5 | 1.4 | n.a. |
| Core EPS (FD) change | 0.4 | (0.7) | n.a. |
Source: Daiwa forecasts
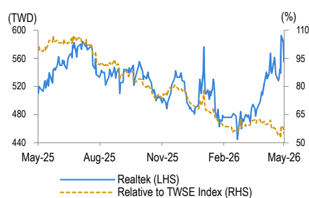
Share price performance
| 12-month range | 445.00-592.00 |
|---|---|
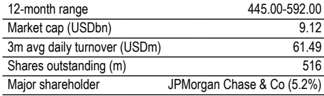
| Market cap (USDbn) | 9.12 |
| 3m avg daily turnover (USDm) | 61.49 |
| Shares outstanding (m) | 516 |
| Major shareholder | JPMorgan Chase & Co (5.2%) |
Financial summary (TWD)
| Year to 31 Dec | 26E | 27E | 28E |
|---|---|---|---|
| Revenue (m) | 136,308 | 153,625 | 183,495 |
| Operating profit (m) | 16,800 | 18,975 | 21,876 |
| Net profit (m) | 16,742 | 18,643 | 21,209 |
| Core EPS (fully-diluted) | 31.847 | 35.464 | 40.345 |
| EPS change (%) | 13.5 | 11.4 | 13.8 |
| Daiwa vs Cons. EPS (%) | 2.1 | (1.1) | (12.0) |
| PER (x) | 17.4 | 15.6 | 13.8 |
| Dividend yield (%) | 4.5 | 4.9 | 5.2 |
| DPS | 25.0 | 27.0 | 29.0 |
| PBR (x) | 5.1 | 4.6 | 4.2 |
| EV/EBITDA (x) | 10.7 | 9.6 | 8.1 |
| ROE (%) | 30.9 | 31.7 | 32.5 |
Source: FactSet, Daiwa forecasts
Realtek: quarterly P&L forecasts
| TWDm | 1Q25 | 2Q25 | 3Q25 | 4Q25 | 1Q26 | 2Q26E | 3Q26E | 4Q26E | 2025 | 2026E | 2027E | 2028E |
|---|---|---|---|---|---|---|---|---|---|---|---|---|
| Revenue | 35,022 | 31,914 | 29,491 | 26,278 | 36,423 | 36,330 | 32,562 | 30,993 | 122,706 | 136,308 | 153,625 | 183,495 |
| COGS | 16,965 | 15,885 | 14,839 | 13,643 | 18,336 | 18,421 | 16,683 | 15,899 | 61,333 | 69,339 | 78,560 | 94,628 |
| Gross profit | 18,057 | 16,029 | 14,652 | 12,635 | 18,087 | 17,909 | 15,879 | 15,094 | 61,374 | 66,968 | 75,065 | 88,867 |
| Opex | 13,153 | 12,021 | 11,538 | 10,301 | 13,755 | 13,406 | 11,788 | 11,219 | 47,014 | 50,168 | 56,090 | 66,991 |
| SG&A | 3,374 | 2,972 | 2,889 | 2,607 | 3,278 | 3,161 | 2,735 | 2,634 | 11,841 | 11,808 | 13,384 | 15,981 |
| R&D | 9,780 | 9,049 | 8,649 | 7,694 | 10,477 | 10,245 | 9,052 | 8,585 | 35,172 | 38,360 | 42,706 | 51,010 |
| Operating profit | 4,904 | 4,008 | 3,113 | 2,335 | 4,332 | 4,503 | 4,091 | 3,875 | 14,360 | 16,800 | 18,975 | 21,876 |
| Pre-tax profit | 5,605 | 4,624 | 4,045 | 2,986 | 4,977 | 5,183 | 4,771 | 4,565 | 17,261 | 19,496 | 21,805 | 24,806 |
| Income taxes | 844 | 715 | 616 | 332 | 649 | 752 | 692 | 662 | 2,507 | 2,754 | 3,162 | 3,597 |
| Net profit | 4,762 | 3,909 | 3,429 | 2,654 | 4,329 | 4,431 | 4,079 | 3,903 | 14,753 | 16,742 | 18,643 | 21,209 |
| O/S (M, fully diluted) | 521 | 515 | 514 | 526 | 526 | 526 | 526 | 526 | 526 | 526 | 526 | 526 |
| FD EPS (TWD) | 9.14 | 7.59 | 6.67 | 5.05 | 8.23 | 8.43 | 7.76 | 7.42 | 28.06 | 31.85 | 35.46 | 40.35 |
| As a %of revenue | ||||||||||||
| Gross profit | 51.6% | 50.2% | 49.7% | 48.1% | 49.7% | 49.3% | 48.8% | 48.7% | 50.0% | 49.1% | 48.9% | 48.4% |
| Opex | 37.6% | 37.7% | 39.1% | 39.2% | 37.8% | 36.9% | 36.2% | 36.2% | 38.3% | 36.8% | 36.5% | 36.5% |
| SG&A | 9.6% | 9.3% | 9.8% | 9.9% | 9.0% | 8.7% | 8.4% | 8.5% | 9.7% | 8.7% | 8.7% | 8.7% |
| R&D | 27.9% | 28.4% | 29.3% | 29.3% | 28.8% | 28.2% | 27.8% | 27.7% | 28.7% | 28.1% | 27.8% | 27.8% |
| Operating profit | 14.0% | 12.6% | 10.6% | 8.9% | 11.9% | 12.4% | 12.6% | 12.5% | 11.7% | 12.3% | 12.4% | 11.9% |
| Net profit | 13.6% | 12.2% | 11.6% | 10.1% | 11.9% | 12.2% | 12.5% | 12.6% | 12.0% | 12.3% | 12.1% | 11.6% |
| Growth (QoQ) | ||||||||||||
| Revenue | 33% | -9% | -8% | -11% | 39% | 0% | -10% | -5% | ||||
| Gross profit | 42% | -11% | -9% | -14% | 43% | -1% | -11% | -5% | ||||
| Operating profit | 70% | -18% | -22% | -25% | 86% | 4% | -9% | -5% | ||||
| Net profit | 40% | -18% | -12% | -23% | 63% | 2% | -8% | -4% | ||||
| FD EPS | 39% | -17% | -12% | -24% | 63% | 2% | -8% | -4% | ||||
| Growth (YoY) | ||||||||||||
| Revenue | 37% | 4% | -4% | 0% | 4% | 14% | 10% | 18% | 8% | 11% | 13% | 19% |
| Gross profit | 39% | 3% | -7% | -1% | 0% | 12% | 8% | 19% | 7% | 9% | 12% | 18% |
| Operating profit | 79% | 1% | -20% | -19% | -12% | 12% | 31% | 66% | 6% | 17% | 13% | 15% |
| Net profit | 52% | -11% | -22% | -22% | -9% | 13% | 19% | 47% | -4% | 13% | 11% | 14% |
| FD EPS | 51% | -11% | -21% | -23% | -10% | 11% | 16% | 47% | -5% | 13% | 11% | 14% |
Source: Company, Daiwa estimates and forecasts
Realtek: 1Q26 revenue mix by application
Source: Daiwa estimates
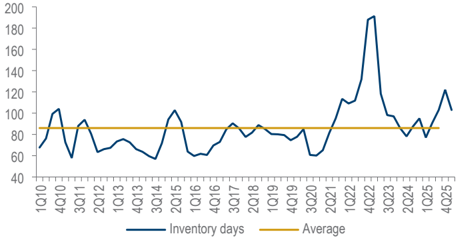
Realtek: quarterly inventory trend
Source: Company
Realtek: monthly revenue run-rate
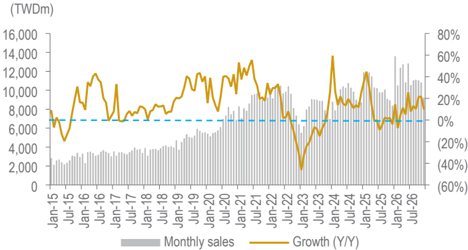
Source: Company, Daiwa forecasts (for May-Dec 2026)
Realtek: 4-quarter forward PER bands
Source: Company, TEJ, Daiwa forecasts
Financial summary
Key assumptions
| Year to 31 Dec | 2021 | 2022 | 2023 | 2024 | 2025 | 2026E | 2027E | 2028E |
|---|---|---|---|---|---|---|---|---|
| Networking & communication (%) | 71 | 76 | 77 | 77 | 77 | 79 | 80 | 81 |
| Computer & peripheral (%) | 14 | 12 | 10 | 11 | 10 | 9 | 9 | 9 |
| Multimedia & consumer (%) | 15 | 13 | 13 | 13 | 13 | 12 | 11 | 10 |
Profit and loss (TWDm)
| Year to 31 Dec | 2021 | 2022 | 2023 | 2024 | 2025 | 2026E | 2027E | 2028E |
|---|---|---|---|---|---|---|---|---|
| Networking & communication revenue | 75,067 | 84,710 | 73,133 | 86,991 | 94,382 | 108,308 | 123,314 | 148,989 |
| Computer & peripheral revenue | 14,542 | 12,871 | 9,464 | 12,180 | 12,379 | 11,782 | 13,340 | 15,607 |
| Other Revenue | 15,896 | 14,209 | 12,582 | 14,223 | 15,945 | 16,218 | 16,972 | 18,900 |
| Total Revenue | 105,504 | 111,790 | 95,179 | 113,394 | 122,706 | 136,308 | 153,625 | 183,495 |
| Other income | 0 | 0 | 0 | 0 | 0 | 0 | 0 | 0 |
| COGS | (52,316) | (57,155) | (54,431) | (56,232) | (61,333) | (69,339) | (78,560) | (94,628) |
| SG&A | (7,910) | (8,863) | (7,633) | (10,073) | (11,841) | (11,808) | (13,384) | (15,981) |
| Other op.expenses | (27,953) | (30,048) | (26,460) | (33,544) | (35,172) | (38,360) | (42,706) | (51,010) |
| Operating profit | 17,325 | 15,724 | 6,655 | 13,545 | 14,360 | 16,800 | 18,975 | 21,876 |
| Net-interest inc./(exp.) | 220 | 733 | 2,335 | 2,504 | 2,548 | 2,685 | 2,830 | 2,930 |
| Assoc/forex/extraord./others | 30 | 465 | 555 | 336 | 353 | 11 | 0 | 0 |
| Pre-tax profit | 17,575 | 16,922 | 9,545 | 16,384 | 17,261 | 19,496 | 21,805 | 24,806 |
| Tax | (722) | (718) | (392) | (1,050) | (2,507) | (2,754) | (3,162) | (3,597) |
| Min. int./pref. div./others | 0 | 0 | 0 | 0 | 0 | 0 | 0 | 0 |
| Net profit (reported) | 16,853 | 16,204 | 9,153 | 15,335 | 14,753 | 16,742 | 18,643 | 21,209 |
| Net profit (adjusted) | 16,853 | 16,204 | 9,153 | 15,335 | 14,753 | 16,742 | 18,643 | 21,209 |
| EPS (reported)(TWD) | 33.000 | 31.623 | 17.847 | 29.900 | 28.619 | 32.477 | 36.165 | 41.142 |
| EPS (adjusted)(TWD) | 33.000 | 31.623 | 17.847 | 29.900 | 28.619 | 32.477 | 36.165 | 41.142 |
| EPS (adjusted fully-diluted)(TWD) | 32.384 | 30.483 | 17.587 | 29.742 | 28.064 | 31.847 | 35.464 | 40.345 |
| DPS (TWD) | 14.000 | 27.023 | 27.000 | 15.499 | 25.369 | 25.000 | 27.000 | 29.000 |
| EBIT | 17,325 | 15,724 | 6,655 | 13,545 | 14,360 | 16,800 | 18,975 | 21,876 |
| EBITDA | 19,626 | 18,528 | 9,680 | 16,889 | 18,079 | 20,961 | 23,689 | 27,554 |
Cash flow (TWDm)
| Year to 31 Dec | 2021 | 2022 | 2023 | 2024 | 2025 | 2026E | 2027E | 2028E |
|---|---|---|---|---|---|---|---|---|
| Profit before tax | 17,575 | 16,922 | 9,545 | 16,384 | 17,261 | 19,496 | 21,805 | 24,806 |
| Depreciation and amortisation | 2,301 | 2,804 | 3,025 | 3,344 | 3,719 | 4,160 | 4,714 | 5,678 |
| Tax paid | (722) | (718) | (392) | (1,050) | (2,507) | (2,754) | (3,162) | (3,597) |
| Change in working capital | (9,811) | (5,938) | 9,803 | 1,875 | 8,115 | 6,359 | (7,082) | (723) |
| Other operational CF items | 9,009 | 5,987 | (4,084) | 3,424 | (3,573) | 0 | 0 | (0) |
| Cash flow from operations | 18,352 | 19,058 | 17,896 | 23,978 | 23,015 | 27,261 | 16,275 | 26,164 |
| Capex | (2,510) | (2,451) | (2,167) | (2,347) | (2,089) | (2,726) | (3,073) | (3,670) |
| Net (acquisitions)/disposals | (45) | (370) | 0 | (2,240) | 0 | 0 | 0 | 0 |
| Other investing CF items | (11,478) | 2,456 | 3,251 | (5,121) | (14,291) | (2,045) | (2,304) | (2,752) |
| Cash flow from investing | (14,033) | (366) | 1,084 | (9,707) | (16,380) | (4,771) | (5,377) | (6,422) |
| Change in debt | 2,903 | 1,107 | (8,977) | 250 | 5,590 | 0 | 0 | 0 |
| Net share issues/(repurchases) | 0 | 0 | 0 | 0 | 0 | 0 | 0 | 0 |
| Dividends paid | (7,150) | (13,847) | (13,847) | (7,949) | (13,078) | (12,888) | (13,919) | (14,950) |
| Other financing CF items | (90) | (98) | (115) | (2,367) | (128) | 0 | 0 | 0 |
| Cash flow from financing | (4,337) | (12,838) | (22,939) | (10,066) | (7,616) | (12,888) | (13,919) | (14,950) |
| Forex effect/others | (81) | 703 | 472 | 383 | (766) | 0 | 0 | 0 |
| Change in cash | (99) | 6,557 | (3,486) | 4,588 | (1,747) | 9,603 | (3,021) | 4,791 |
| Free cash flow | 15,842 | 16,607 | 15,730 | 21,631 | 20,926 | 24,535 | 13,202 | 22,494 |
Source: FactSet, Daiwa forecasts
Financial summary continued …
Balance sheet (TWDm)
| Year to 31 Dec | 2021 | 2022 | 2023 | 2024 | 2025 | 2026E | 2027E | 2028E |
|---|---|---|---|---|---|---|---|---|
| Cash & short-term investment | 52,891 | 56,913 | 43,590 | 55,099 | 61,376 | 70,978 | 67,957 | 72,749 |
| Inventory | 16,549 | 25,553 | 11,757 | 13,506 | 19,561 | 10,834 | 19,298 | 16,998 |
| Accounts receivable | 15,989 | 12,013 | 12,757 | 12,305 | 15,011 | 18,599 | 19,281 | 25,964 |
| Other current assets | 817 | 1,013 | 1,183 | 3,747 | 1,409 | 1,409 | 1,409 | 1,409 |
| Total current assets | 86,245 | 95,492 | 69,288 | 84,658 | 97,357 | 101,821 | 107,946 | 117,120 |
| Fixed assets | 6,303 | 5,210 | 7,068 | 8,441 | 10,100 | 11,453 | 12,970 | 14,766 |
| Goodwill & intangibles | 2,232 | 2,413 | 2,625 | 2,659 | 3,475 | 2,732 | 2,679 | 2,593 |
| Other non-current assets | 6,452 | 10,586 | 14,836 | 18,138 | 18,972 | 18,972 | 18,972 | 18,972 |
| Total assets | 101,232 | 113,701 | 93,815 | 113,897 | 129,903 | 134,978 | 142,568 | 153,451 |
| Short-term debt | 13,342 | 13,738 | 4,250 | 4,500 | 10,090 | 10,090 | 10,090 | 10,090 |
| Accounts payable | 11,443 | 10,496 | 7,273 | 9,584 | 11,738 | 12,958 | 15,022 | 18,681 |
| Other current liabilities | 34,036 | 38,310 | 34,723 | 43,877 | 52,928 | 52,928 | 52,928 | 52,928 |
| Total current liabilities | 58,821 | 62,545 | 46,246 | 57,961 | 74,756 | 75,976 | 78,040 | 81,699 |
| Long-term debt | 1,003 | 1,713 | 2,227 | 0 | 0 | 0 | 0 | 0 |
| Other non-current liabilities | 2,456 | 2,680 | 3,104 | 2,978 | 2,935 | 2,935 | 2,935 | 2,935 |
| Total liabilities | 62,280 | 66,938 | 51,577 | 60,939 | 77,691 | 78,911 | 80,975 | 84,634 |
| Share capital | 5,107 | 5,129 | 5,129 | 5,129 | 5,155 | 5,155 | 5,155 | 5,155 |
| Reserves/R.E./others | 33,836 | 41,625 | 37,100 | 47,819 | 47,047 | 50,902 | 56,427 | 63,652 |
| Shareholders' equity | 38,943 | 46,753 | 42,228 | 52,948 | 52,202 | 56,057 | 61,582 | 68,807 |
| Minority interests | 10 | 10 | 10 | 10 | 10 | 10 | 10 | 10 |
| Total equity & liabilities | 101,232 | 113,701 | 93,815 | 113,897 | 129,903 | 134,978 | 142,568 | 153,451 |
| EV | 247,573 | 244,658 | 249,006 | 235,520 | 234,834 | 225,231 | 228,252 | 223,461 |
| Net debt/(cash) | (38,546) | (41,462) | (37,113) | (50,599) | (51,286) | (60,888) | (57,867) | (62,659) |
| BVPS (TWD) | 76.256 | 91.242 | 82.339 | 103.240 | 101.263 | 108.740 | 119.459 | 133.473 |
Key ratios (%)
| Year to 31 Dec | 2021 | 2022 | 2023 | 2024 | 2025 | 2026E | 2027E | 2028E |
|---|---|---|---|---|---|---|---|---|
| Sales (YoY) | 35.7 | 6.0 | (14.9) | 19.1 | 8.2 | 11.1 | 12.7 | 19.4 |
| EBITDA (YoY) | 84.7 | (5.6) | (47.8) | 74.5 | 7.0 | 15.9 | 13.0 | 16.3 |
| Operating profit (YoY) | 100.5 | (9.2) | (57.7) | 103.5 | 6.0 | 17.0 | 12.9 | 15.3 |
| Net profit (YoY) | 91.7 | (3.8) | (43.5) | 67.5 | (3.8) | 13.5 | 11.4 | 13.8 |
| Core EPS (fully-diluted) (YoY) | 91.3 | (5.9) | (42.3) | 69.1 | (5.6) | 13.5 | 11.4 | 13.8 |
| Gross-profit margin | 50.4 | 48.9 | 42.8 | 50.4 | 50.0 | 49.1 | 48.9 | 48.4 |
| EBITDA margin | 18.6 | 16.6 | 10.2 | 14.9 | 14.7 | 15.4 | 15.4 | 15.0 |
| Operating-profit margin | 16.4 | 14.1 | 7.0 | 11.9 | 11.7 | 12.3 | 12.4 | 11.9 |
| Net profit margin | 16.0 | 14.5 | 9.6 | 13.5 | 12.0 | 12.3 | 12.1 | 11.6 |
| ROAE | 49.3 | 37.8 | 20.6 | 32.2 | 28.1 | 30.9 | 31.7 | 32.5 |
| ROAA | 18.8 | 15.1 | 8.8 | 14.8 | 12.1 | 12.6 | 13.4 | 14.3 |
| ROCE | 36.8 | 27.2 | 12.0 | 25.5 | 24.0 | 26.2 | 27.5 | 29.1 |
| ROIC | n.a. | n.a | n.a | n.a | n.a | n.a. | n.a. | n.a |
| Net debt to equity | n.a. | n.a. | n.a. | n.a. | n.a. | n.a. | n.a. | n.a. |
| Effective tax rate | 4.1 | 4.2 | 4.1 | 6.4 | 14.5 | 14.1 | 14.5 | 14.5 |
| Accounts receivable (days) | 51.3 | 45.7 | 47.5 | 40.3 | 40.6 | 45.0 | 45.0 | 45.0 |
| Current ratio (x) | 1.5 | 1.5 | 1.5 | 1.5 | 1.3 | 1.3 | 1.4 | 1.4 |
| Net interest cover (x) | n.a. | n.a. | n.a. | n.a. | n.a. | n.a. | n.a. | n.a. |
| Net dividend payout | 81.3 | 82.1 | 85.5 | 86.9 | 87.7 | 87.4 | 83.1 | 80.2 |
| Free cash flow yield | 5.5 | 5.8 | 5.5 | 7.6 | 7.3 | 8.6 | 4.6 | 7.9 |
Source: FactSet, Daiwa forecasts
Company profile
Realtek focuses on research, design, development and distribution of integrated circuits (ICs) for applications across networking & communication (NC), computer & peripheral (CP) and multimedia & consumer (MM). The majority of its revenue comes from NC products, including WiFi, Bluetooth, Ethernet and switch controllers. It also provides diversified CP products such as audio codec, IP cam, and solid-state drive (SSD) controllers as well as MM products like TV SoC and monitor controllers.
ESG analysis
ESG risks
| Risks | Analyst comments | |
|---|---|---|
| G | Executive/board quality | Realtek's Board of Directors consists of nine members whose expertise spans industry, academia, finance, accounting, and management, providing the company with a broad and diverse range of professional perspectives. Three of these directors are independent, representing 33 percent of the board and exceeding the regulatory minimum requirement of 20 percent for independent directors. This higher proportion of independent directors enhances oversight, helps safeguard shareholder interests, and supports more objective decision - making. However, an important governance risk remains in the area of board diversity. The board currently includes only one female director out of nine members, which represents 11 percent of the total. This limited female representation may constrain the breadth of viewpoints and experiences reflected in board discussions and could be perceived as misaligned with evolving stakeholder expectations and best practices on gender diversity in corporate governance. |
| Capital management | In the past 8 years, Realtek's dividend payout ratios were above 80%. As a fabless company, it does not need high capital expenditure for manufacturing sites. Realtek's business has shown stable earnings growth over its 30-year history. Thus, we see its dividend policy with a high payout ratio as appropriate. | |
| Related party & transaction | Realtek's related-party transactions are primarily with G.M.I. Technology Inc. and Greatek Electronics Inc. Realtek pays certain processing costs to related parties. These payments are made under standard commercial terms and conditions. Overall, we do not observe any significant impact on Realtek's business arising from these related-party transactions. | |
| S | Supply chain management | Realtek has formulated a set of supplier management regulations in accordance with Realtek's Supplier Sustainability Management Policy. It requires suppliers to obtain ISO9001 quality management system certification to ensure that all of its suppliers possess a high level of environment awareness. |
| E Water & wastewater management | As a fabless company without manufacturing plants, Realtek does not produce much wastewater compared to manufacturing companies, and thus has a relatively limited impact on the environment. Realtek has implemented a water conservation plan to increase water efficiency, such as the reuse of rainwater, re-circulating water in its cooling tower and installing water- saving devices. Its water saving rate (=reduced water consumption/total water withdrawn) increased gradually. | |
| E | Waste & hazardous materials management | The company reports to the Executive Yuan's Environmental Protection Administration waste and reporting management system every month on the quantity of waste and its method of disposal. In 2024, it produced 26.10 tonnes of industrial waste, maintaining over a 90% recycling rate for hazardous industrial waste. |
| E | GHG emissions | Realtek has independently conducted GHG emission inventory and management at its Hsinchu Headquarters since 2019. In 2022, Realtek implemented a comprehensive ISO 14064-1:2018 GHG inventory and passed third-party verification. As of 2024, the company has completed GHG emission inventory and third-party verification for all sites within the Realtek Group. |
Note: Management score represents a company's ability to manage/benefit from certain ESG topics. The scores range from 1 to 3, with 1 being the strongest.
Update Date: 29 Jan 2026
Source: Daiwa, Company